
Figures & data
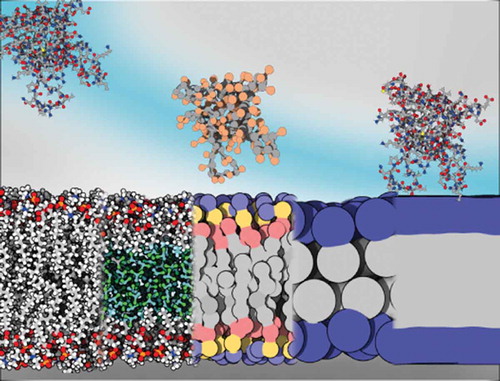
Figure 1. Membrane models and their respective compatible protein description. Membranes from left to right: all-atom, HMMM, MARTINI, SBCG, implicit. Proteins (Pleckstrin Homology (PH) domain, 2DA0) from left to right: all-atom, all-atom, half-MARTINI/half-RBCG, SBCG, all-atom. Rendered with 3DProteinImaging [Citation12]
![Figure 1. Membrane models and their respective compatible protein description. Membranes from left to right: all-atom, HMMM, MARTINI, SBCG, implicit. Proteins (Pleckstrin Homology (PH) domain, 2DA0) from left to right: all-atom, all-atom, half-MARTINI/half-RBCG, SBCG, all-atom. Rendered with 3DProteinImaging [Citation12]](/cms/asset/75dadb55-bfab-409f-b071-548e56a5246f/tapx_a_1932589_f0001_oc.jpg)
Figure 2. Tyrosine-choline π-cation interactions in Bacillus thurigiensis phosphatidylinositol-specific phospholipase C anchored at the surface of a PC lipid bilayer. Reprinted from [Citation3], with permission from ACS Publications
![Figure 2. Tyrosine-choline π-cation interactions in Bacillus thurigiensis phosphatidylinositol-specific phospholipase C anchored at the surface of a PC lipid bilayer. Reprinted from [Citation3], with permission from ACS Publications](/cms/asset/1c7ec861-4119-4255-ac78-078199494ffb/tapx_a_1932589_f0002_oc.jpg)
Figure 3. Phenol-tetramethylammonium potential energy surface obtained with quantum mechanics calculations, the CHARMM36 force field and the CHARMM-WYF modification of the Lennard-Jones potential. Reprinted from [Citation56], with permission from ACS Publications
![Figure 3. Phenol-tetramethylammonium potential energy surface obtained with quantum mechanics calculations, the CHARMM36 force field and the CHARMM-WYF modification of the Lennard-Jones potential. Reprinted from [Citation56], with permission from ACS Publications](/cms/asset/1d768f46-6681-495c-a7c8-95d6b89fc10a/tapx_a_1932589_f0003_oc.jpg)
Figure 4. Regular atomistic bilayer (right) and HMMM bilayer (left) model. Figure inspired by the Ohkubo et al. 2012 [Citation49] and Vermaas et al. 2015 [Citation85]
![Figure 4. Regular atomistic bilayer (right) and HMMM bilayer (left) model. Figure inspired by the Ohkubo et al. 2012 [Citation49] and Vermaas et al. 2015 [Citation85]](/cms/asset/792672e3-b5b7-4141-843e-7e97d3e866bd/tapx_a_1932589_f0004_oc.jpg)
Figure 5. Schematic atomistic representation of the α-tocopherol transfer protein interacting with a DOPC/DOPE phospholipid bilayer (grey). The mobile gate (purple) at the entrance of the cavity interacts with the PIP2 headgroup (red) and the lipids. The neighbouring motif is coloured in blue, and the α-tocopherol molecule bound to the protein in yellow. The head of PIP2 facilitates anchoring of α-TTP to the membrane. Rendered with 3DProteinImaging [Citation12]. PDB ID: 3W67 [Citation95]
![Figure 5. Schematic atomistic representation of the α-tocopherol transfer protein interacting with a DOPC/DOPE phospholipid bilayer (grey). The mobile gate (purple) at the entrance of the cavity interacts with the PIP2 headgroup (red) and the lipids. The neighbouring motif is coloured in blue, and the α-tocopherol molecule bound to the protein in yellow. The head of PIP2 facilitates anchoring of α-TTP to the membrane. Rendered with 3DProteinImaging [Citation12]. PDB ID: 3W67 [Citation95]](/cms/asset/0028204e-a25e-4f5b-8e0c-8ca1c8189e19/tapx_a_1932589_f0005_oc.jpg)
Figure 6. Bar domains structures (N-BAR:1ZWW [Citation134], F-BAR:2V0O [Citation135], I-BAR:1Y20 [Citation136]) coloured by subunit. Rendered with 3DProteinImagning [Citation12]
![Figure 6. Bar domains structures (N-BAR:1ZWW [Citation134], F-BAR:2V0O [Citation135], I-BAR:1Y20 [Citation136]) coloured by subunit. Rendered with 3DProteinImagning [Citation12]](/cms/asset/1bcfb50d-4fc5-4167-b18a-142bcc18b99e/tapx_a_1932589_f0006_oc.jpg)