Figures & data
Figure 1. An overview of MOHAWk and procedures for using the tool (Saelens et al. Citation2016, Broomhall et al. Citation2004, Millstein et al. Citation2013).
Figure 2. Photographs of Sites 1A (top), Site 1B (middle) and the temporary ‘Hello Hollow’ statue (bottom). Photographs of Site 1A and 1B taken by Margaret Pulis. Photograph of ‘Hello Hollow’ was taken by Manchester Metropolitan University (permission approved by the Corporate Marketing and Communications department at Manchester Metropolitan University). All faces have been obscured.
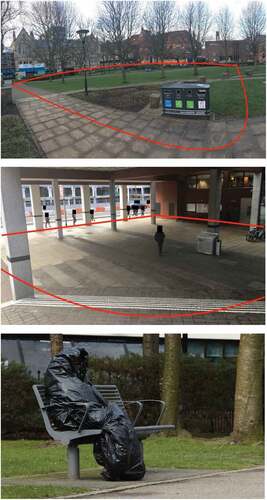
Figure 3. Photographs of Site 2A (top) and Site 2B (bottom). Photographs taken by Jack Benton.
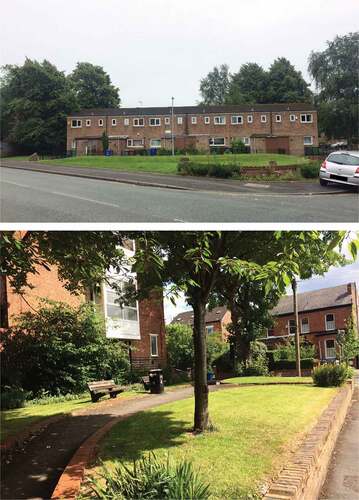
Figure 4. Photographs of Site 3. Photographs taken by Jack Benton.
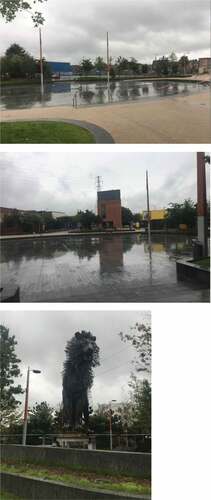
Table 1. Summary of the methods and analyses used to assess each aim across the three studies.
Table 2. Urban space characteristics and mean behavioural counts per hour for all three studies (five sites).
Table 3. Reliability estimates using the average ICC for shortened observation schedules. Numbers in bold represent ‘good’ (ICC > 0.75) or ‘excellent’ (ICC > 0.9) reliability scores.
Figure 5. Frequencies of children (top left), teens (top right), adults (bottom left) and older adults (bottom right). Observations were carried out at Site 2A, observed between 8–6 pm on weekdays (average of Monday to Friday), Saturday and Sunday during one week in July 2017.