Figures & data
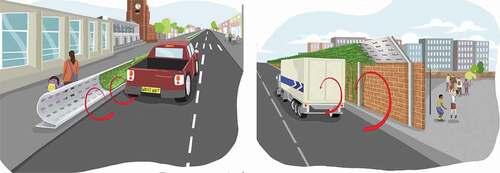
Figure 1. Schematic of the ‘typical’ street canyon configuration specified for the initial modelling trials with the example of leeward wall (left) and leeward wall and baffle (right)
Figure 2. Relative pollutant concentrations in the modelled canyon street with (a) no barrier wall, (b) a leeward roadside wall, (c) a leeward roadside wall with baffle. Pollutant levels are time-averaged, normalised concentrations; the white fine-scale arrows indicate wind flow vectors at y = 0 m within the street canyon; see for streetscape geometry
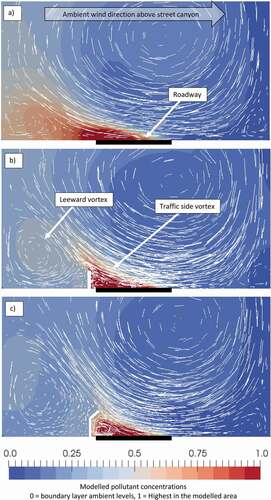
Table 1. Spatially averaged concentrations in the pedestrian space at roadside in the no barrier case and relative percentage change for each barrier and barrier + baffle combination
Figure 3. Relative pollutant concentrations in the modelled canyon street with (a) no barrier wall, (b) a windward roadside wall, (c) a windward roadside wall with baffle. Pollutant levels are time-averaged, normalised concentrations; the white fine-scale arrows indicate wind flow vectors at y = 0 m within the street canyon; see for streetscape geometry
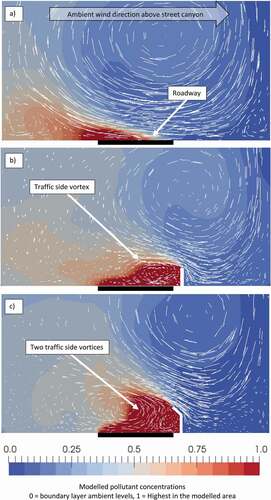
Figure 4. Shaping of low boundary walls (left) and in baffles retrofit to existing infrastructure (right) can substantially reduce particulate matter dispersion into pedestrian areas. Figure preparation by @AzizaIllustrates