Figures & data
Figure 1. Core skills oral presentation workflow.
Sessions dedicated to oral presentation skills are spread throughout the academic year. An orientation lecture in semester 1 conveys the theory, and a formative presentation permits practice of that theory. In semester 2 skills are assessed with effort impacting upon course grades. Topics discussed by student groups at each presentation are displayed.
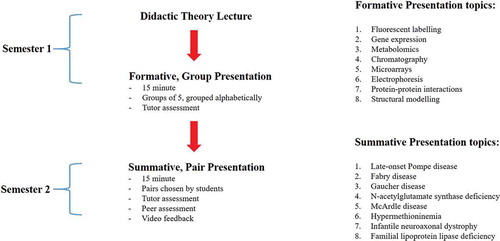
Figure 2. The student experience of presentations.
After each presentation students were asked ‘On a scale of 1 → 5 (where 1 = fully comfortable and 5 = anxious) how would you rate your experience during your recent [formative/summative] presentation?’. Respondent number: Questionnaire A: 20, Questionnaire B: 38. Percentages rounded to 1 decimal place.
![Figure 2. The student experience of presentations.After each presentation students were asked ‘On a scale of 1 → 5 (where 1 = fully comfortable and 5 = anxious) how would you rate your experience during your recent [formative/summative] presentation?’. Respondent number: Questionnaire A: 20, Questionnaire B: 38. Percentages rounded to 1 decimal place.](/cms/asset/81d941ec-79c9-4fa2-9cf0-16b0388e263d/rhep_a_1587717_f0002_oc.jpg)
Figure 3. Student opinions of course delivery of presentation skill training.
Students were asked to evaluate group and pair working as present within the formative and summative presentation sessions, respectively. Scale: 1 = No/disagree/poor → 5 = Yes/agree/excellent. Respondent number: Questionnaire A: 20, Questionnaire B: 38. Percentages rounded to 1 decimal place.
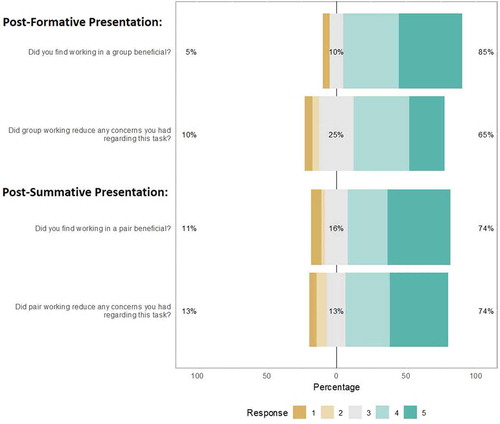
Figure 4. Student opinions of assessor feedback.
(a) Students were asked to evaluate staff feedback after each presentation (respondent number: Questionnaire A: 18; Questionnaire B: 38. Inserts display response rate to individual category contributing to the aggregate value. Questions are paraphrased and related to questionnaire. Percentages rounded to 1 decimal place). (b) Students were asked to indicate what performance areas they would like to see more comment on. Scale: 1 = No/disagree/poor → 5 = Yes/agree/excellent. Respondent number: Questionnaire A: 20. Values rounded to whole percentage.
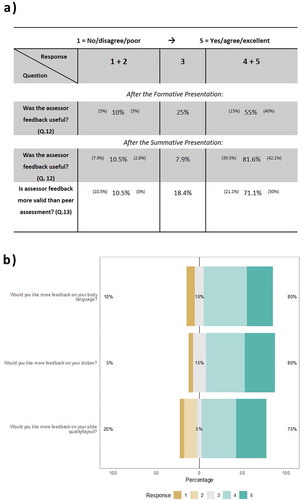
Figure 5. Student opinions on their ability to assess another’s work.
(a) Students were asked to evaluate their confidence in assessing another’s work (respondent number: Questionnaire A: 20; Questionnaire B: 38. Inserts display response rate to individual category contributing to the aggregate value. Questions are paraphrased and related to questionnaire. Percentages rounded to 1 decimal place). (b) Students were asked ‘Would you trust your fellow student’s opinions of your efforts? Scale: 1 = No/disagree/poor → 5 = Yes/agree/excellent. Respondent number: Questionnaire A: 20; Questionnaire B: 38. Values rounded to whole percentage.
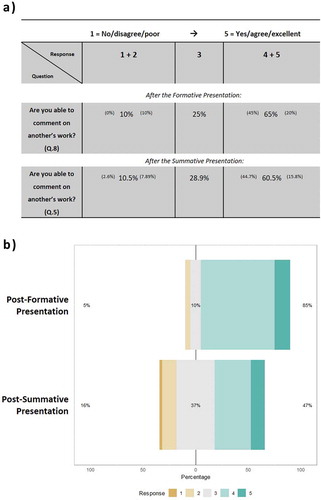
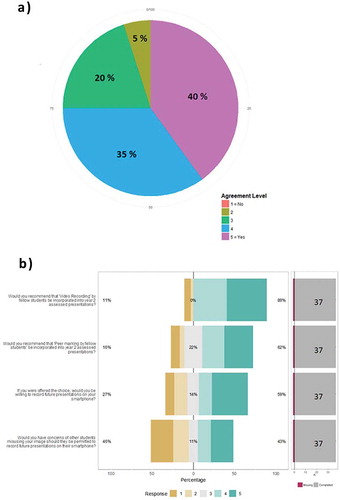
Figure 6. Student opinions on peer feedback Students were asked to evaluate feedback from their peers.
(a) Responses to ‘If your fellow students were provided the opportunity to rate your own performance would you be happy with this as a method of feedback?’ after the formative and summative presentations (Respondent number: Questionnaire A: 20, Questionnaire B: 38) (b) Response to ‘Questionnaire B’ questions querying views on peer feedback after the summative presentation. Number of respondents who failed to answer individual questions is also displayed. Scale: 1 = No/disagree/poor → 5 = Yes/agree/excellent. Values rounded to whole percentage. N.B.image percentages based on number of question respondents.
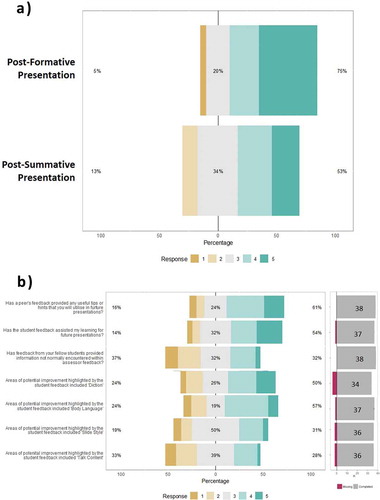
Figure 7. Student impressions of video feedback.
Student opinions of the different facets of video feedback were analysed after its employment during the summative presentation. Number of respondents who failed to answer individual questions is also displayed. Scale: 1 = No/disagree/poor → 5 = Yes/agree/excellent. Values rounded to whole percentage. N.B. image percentages based on number of question respondents.
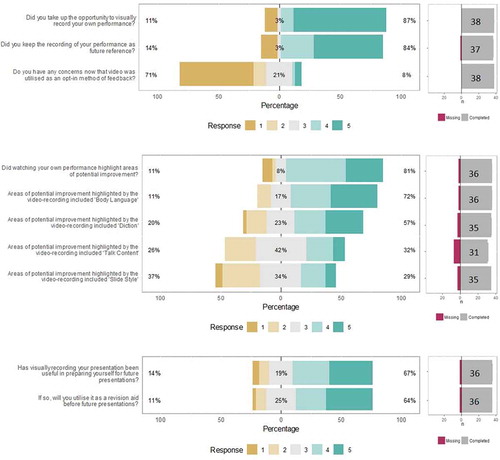
Table 1. Evaluation of the impact of the course design on the student.
Figure 8. Student opinions on future course innovations.
Students were asked if some of the techniques employed in this course, and others, could be utilised in other forthcoming courses. (a) Responses to ‘Would you appreciate a debriefing with a member of staff where your recorded presentation was the focus of discussion?’, (Respondent number: 20); (b) Response to questions after the summative presentation querying views on engagement and future application. Number of respondents who failed to answer individual questions is also displayed. Scale: 1 = No/disagree/poor → 5 = Yes/agree/excellent. Values rounded to whole percentage. N.B.image percentages based on number of question respondents.