Figures & data
Table 1. Distribution of score proportions to total student mark. The online quiz for the Model 2 laboratories was on a pass/fail basis.
Figure 1. Flowcharts of the two models compared in the study. a) Model 1: Traditional laboratory where students spend 3 h with the laboratory demonstrator b) Model 2: pre-laboratory preparation can be done online, including a feedback loop, a reduced face-to-face time of 1 h with the experimental rig and reflection of laboratory in a laboratory report that can be handed in 2–3 days after the face-to-face session.
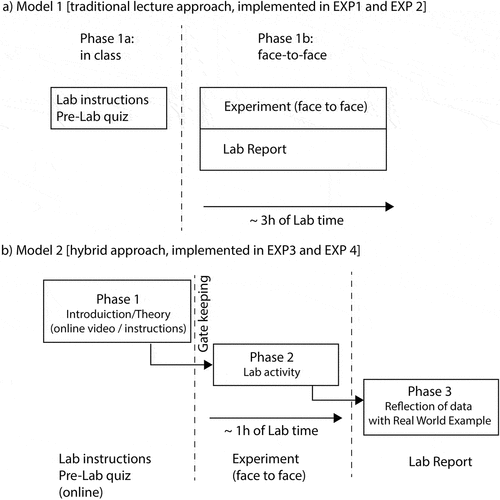
Table 2. Intended Learning Outcomes for CIVL2131 students.
Table 3. Question in student survey.
Table 4. Thematic analysis of the general student feedback from end-of-year survey (SeCAT).
Figure 2. Average student score (and variance) of the four experiments. Model 1 represented by (EXP1 & EXP2) and Model 2 by EXP3 & EXP4.
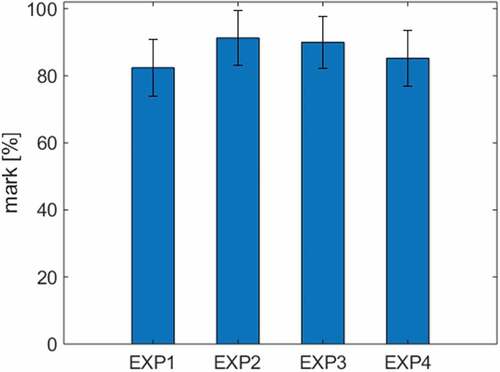
Table 5. Descriptive statistics and Pearson Correlation for CIVL2131 (N = 167). The grade scale for the average values (Mean) column is from Fail (1) to High Distinction (7). The four experiments show marks ‘out of 20’ and were not converted in this table.
Table 6. Regression coefficient of assessment tasks and Pearson Correlation (N = 167). The t-statistic is the coefficient divided by its standard error, r is the regression coefficient and p indicates the statistical significance.
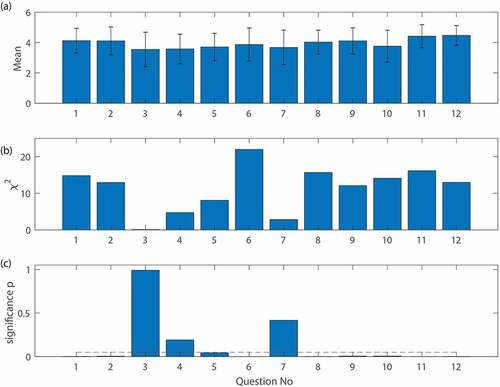
Figure 3. Graphical analysis of the student survey (see ) for the experiments. a) depicts the average score of the survey with the 5-point Likert scale on the y-axis. b) The χ2 -goodness-of-fit test (ANOVA) and c) the asymptotical significance test (ANOVA).