Figures & data
Table 1. Count of seeds in Lachemilla hirta and Lachemilla hispidula obtained in the mesh bag treatment and control treatment during wet and dry season.
Table 2. Average fruit formation and comparison of fruit formation between treatments.
Table 3. List of the total of arthropods collected in L. hirta and L. hispidula.
Table 4. List of visitors with its possible parasitoids and hyperparasitoids found in Lachemilla hirta and L. hispidula.
Figure 1. Scatopsidae in Lachemilla hirta flowers (above) and in L. hispidula (below).
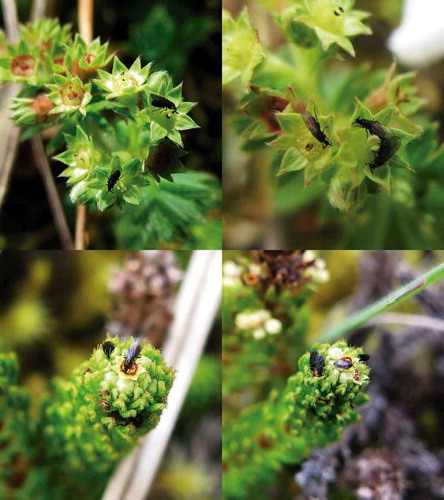
Table 5. Flow cytometric seed screen of the achenes of the investigated Lachemilla species.
Figure 2. (a) Histogram of autonomous apomixis in Lachemilla hirta. The first peak corresponds to the embryo 2x while the second peak corresponds to the endosperm 4x. The third peak corresponds to the standard sample (Pisum sativum). (b) Histogram of pseudogamous apomixis in L. hirta. The first peak corresponds to the embryo 2x while the second peak corresponds to the endosperm 6x. The third peak corresponds to the standard sample (Pisum sativum).
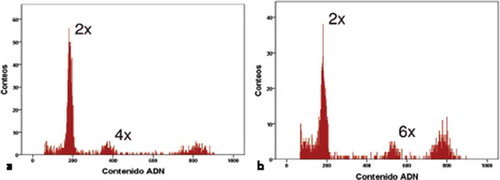
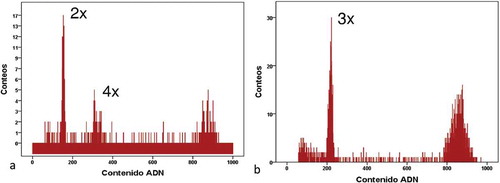
Figure 3. (a) Histogram of autonomous apomixis in Lachemilla hispidula. The first peak corresponds to the embryo 2x while the second peak corresponds to the endosperm 4x. The third peak corresponds to the standard sample (Pisum sativum). (b) Histogram of triploid embryos in L. hispidula. The first peak corresponds to the embryo 3x while the second peak corresponds to the standard sample (Pisum sativum).