Figures & data
Figure 1. Map of Ecuador showing the sampling samples of P. incana and P. racemosa in this study. (A) Illinizas Ecological Reserve, (B) Mojanda Lagoon and (C) Cayambe-Coca National Park. Obtained from ArcGIS (Geographic Information System) Software by Esri (Environmental Systems Research Institute) for Windows, version 10.5 × 64 Bits. (Release 10. Redlands, California)
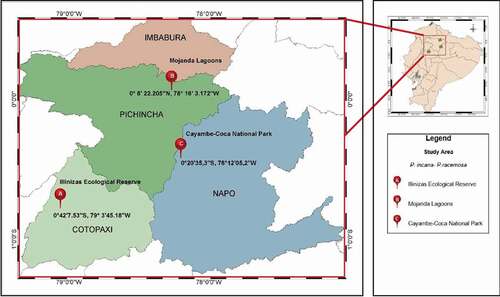
Table 1. Taxonomic review with collections from the herbarium of the department of biological sciences of the Pontifical Catholic University of Ecuador in Quito (Herbarium QCA)
Table 2. Configuration of landmarks in each plant structure of P. incana and P. racemosa in this study, with a description of the reference points on the right: a) Leaves, b) Stomata, c) Flowers, d) Pollen
Figure 2. Result of the principal component analysis (PCA) for P. incana and P. racemosa. The dispersion of points along the horizontal axis (x) PC1 and the vertical axis (y) PC2 is represented for (A) compound leaves and (B,C) flowers. In some cases, more than one graph per organ is presented because different behaviours per population were identified, in flowers this apply for population Illinizas Ecological Reserve (B) instead population of Mojanda lagoon and Cayambe-Coca National Park are clustered (C). Wire graphs showing the main directions of variation from the consensus are also presented
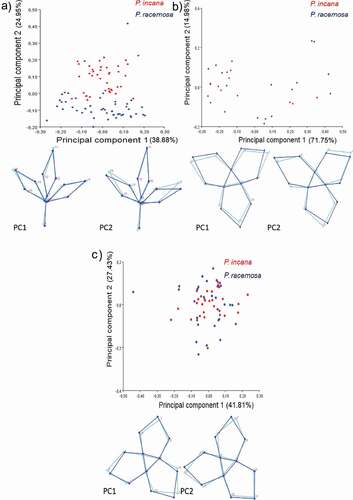
Figure 3. Results of the discriminant analysis of the different plant structures analyzed as potential morphological characters for the distinction between P. incana species (red bars) and P. racemosa (blue bars): (A) compound leaves and (B) flowers
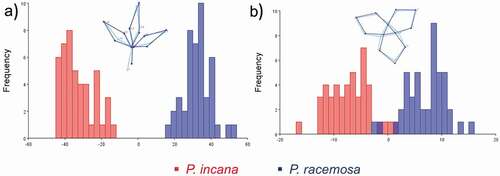
Table 3. P values for the permutation test (1000 rounds) based on the Mahalanobis and Procrustes distance of compound leaves (distance values for populations A, B, and C, respectively) between species (groups)
Table 4. P values for the permutation test (1000 rounds) based on the Mahalanobis and Procrustes distance of flowers (distance values for populations A, B and C, respectively) between species (groups)
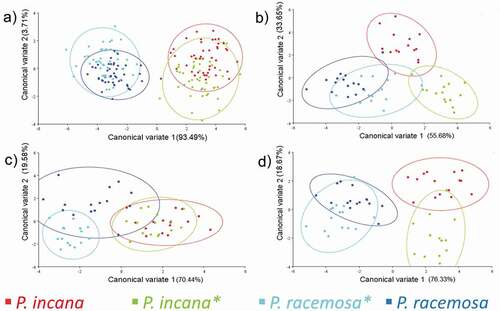
Figure 4. Result of the analysis of canonical variants (CVA) for the compound leaves and flowers of parental species and reforested jointly (P. incana * and P. racemosa *). Scatter plots of CV1 and CV2 variables with a 95% confidence level. A) Population A (Illinizas Ecological Reserve), B (Mojanda Lagoons) and C (Cayambe Coca National Park) for compound leaves, B) Population A, for flowers, C) Population B for flowers and D) Population C for flowers