Figures & data
Figure 1. Study area: Bosque Protector Puyango (turquoise), located in southwestern Ecuador, bisected by the Puyango river and overlapping with Bosque Petrificado de Puyango (gray shaded area). Points indicate the sampling location, color-coded by method as follows, purple: song recording stations, blue: count points, green: mist-netting stations, and yellow: transect starting points.
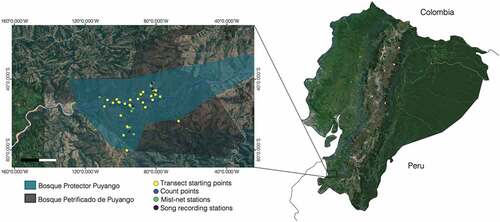
Figure 2. An illustration of the environmental differences by seasonality at BP puyango. the picture shows a perched Vermilion Flycatcher (Pyrocephalus rubinus) during the dry (left) and rainy (right) season. photos were taken by Alejandro Montalvo.
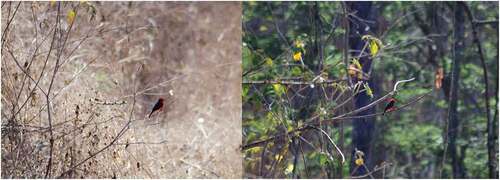
Table 1. List of species at BP Puyango. (e) Endemic, (*) Present only in one season. Abundances reported by Platt in 1991 are shown in italics and abundances reported from bibliographic sources are shown in bolded italics
Figure 3. Boxplot of the avian community in BP puyango by family and seasonality. Dots represent the abundance of different species within a family.
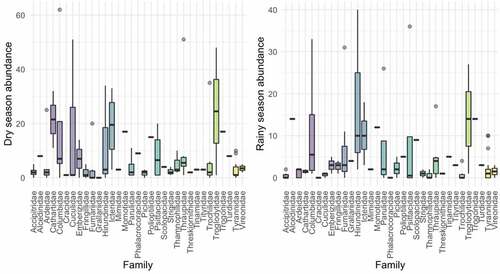
Table 2. Results of rank-abundance dominance (RAD) models by seasonality. The best fit models display the lowest deviance, lowest AIC and lowest AICc (*)
Figure 4. Rank-Abundance dominance curves of the bird species from BP puyango by seasonality. best fit model of species dominance is log-Normal during the dry season (green line) and Zipf-Mandelbrot during the rainy season (Orange line). Blue dots represent different species.
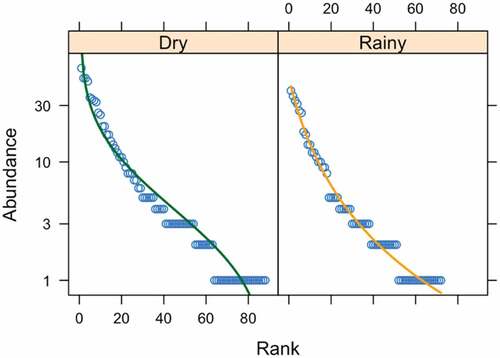
Figure 5. Non-metric multidimensional scaling (NMDS) for the abundance of bird species observed during the dry (yellow dots) and rainy (blue dots) season in BP puyango. Dots represent species’ abundances found within a sampling unit.
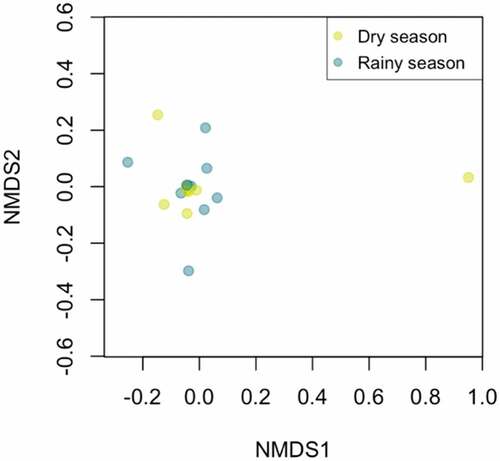
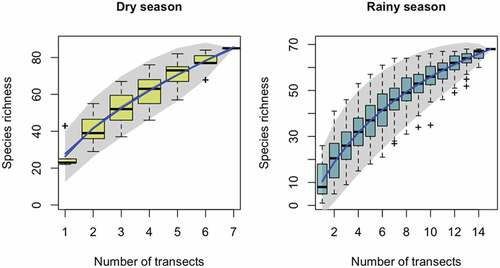
Figure 6. Species accumulation curve by number of transects sampled on each season. The expected curve under 100 permutations is shown in dark blue. Gray shade is showing the 0.95 confidence area. Boxplots show the averaged species richness weighted by sampling effort found from linear interpolation of single random permutations.