Figures & data
Figure 1. GCSE performance by ethnic group, gender and FSM 2014–15 (adapted from Department for Education (DfE) Citation2016c).
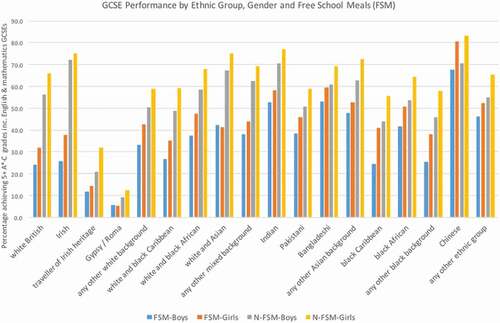
Table 1. Overview of sensitising questions.
Table 2. summary of findings.
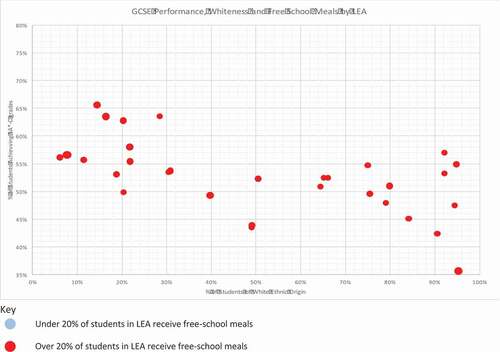
Figure 2. GCSE performance, whiteness and free school meals (adapted from Department for Education (DfE) Citation2016b, Department for Education (DfE) Citation2016c).