Figures & data
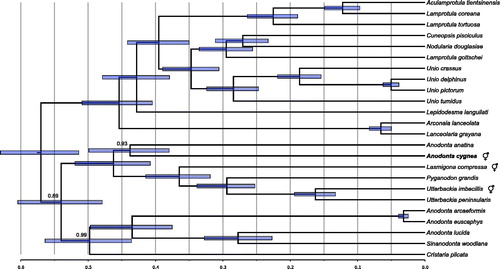
Figure 1. Phylogenetic tree showing the relationship of the announced mitogenome (in boldface) with the 23 closest relatives identified by BLAST search in nr database. It places A. cygnea as a sister taxon to A. anatina. The “latin name” fields of GenBank records were used to identify sequences, but several of these may be incorrect. In particular, the species related to Sinanodonta woodiana should most likely not be classified as Anodonta, likewise the three Lamprotula species should also follow different naming convention, most likely that presented recently by Lopes-Lima et al. (Citation2017). The following records were used: Aculamprotula tientsinensis KR873102 (Wu et al. Citation2016), Anodonta anatina KF030964 (Soroka and Burzyński Citation2015), Anodonta arcaeformis KF667530 (An et al. Citation2016), Anodonta euscaphys KP187851, Anodonta lucida KF667529 (Song et al. Citation2016), Sinanodonta woodiana HQ283346 (Soroka Citation2010), Arconaia lanceolata KJ144818 (Wang et al. Citation2016a), Cristaria plicata GU944476 (Lee et al. Citation2012), Cuneopsis pisciculus KP273584, Lamprotula coreana JX050180, Lamprotula gottschei KJ018924 (He et al. Citation2016), Lamprotula tortuosa KC109779 (Wang et al. Citation2013), Lanceolaria grayana KJ495725, Lasmigona compressa HM856638 (Breton et al. Citation2011), Lepidodesma languilati KT381195 (Zhou et al. Citation2016), Pyganodon grandis FJ809754 (Breton et al. Citation2009), Unio crassus KY290446 (Burzyński et al. Citation2017), Unio delphinus KT326917 (Fonseca et al. Citation2016), Nodularia douglasiae KM657954 (Wang et al. Citation2016b), Unio pictorum HM014130 (Soroka and Burzyński Citation2010), Unio tumidus KY021078 (Soroka and Burzyński Citation2017), Utterbackia imbecillis HM856637 (Breton et al. Citation2011), and Utterbackia peninsularis HM856636 (Breton et al. Citation2011). Bayesian Inference, as implemented in BEAST (Bouckaert et al. Citation2014) was used to reconstruct the phylogeny. All the records were downloaded, reoriented to the common origin and aligned using ClustalW (Larkin et al. Citation2007). Since these genomes have the same structure and similar gene lengths, the only alignment ambiguities concerned the unassigned regions. However, these were inconsistent and have no influence on the final phylogeny due to complete elimination of columns with missing data. The optimal model of sequence evolution (GTR + G with relaxed, lognormal clock), matching the observed pattern of substitutions was selected, as previously described (Burzyński et al. Citation2017). The MCMC chains were run in quadruplicates for 20 × 106 generations to reach ESS of at least 300 for each parameter. The four runs were convergent so the final tree samples were combined using logcombiner. The Maximum Clade Credibility tree was generated using treeannotator. The tree was visualized in FigTree (Rambaut Citation2009), and the root of the tree was scaled to match that of the recently published mitogenomic analysis (Burzyński et al. Citation2017). All nodes have posterior probabilities of 1.0, except for the ones indicated. The node bars represent 95% CI on node heights.