Figures & data
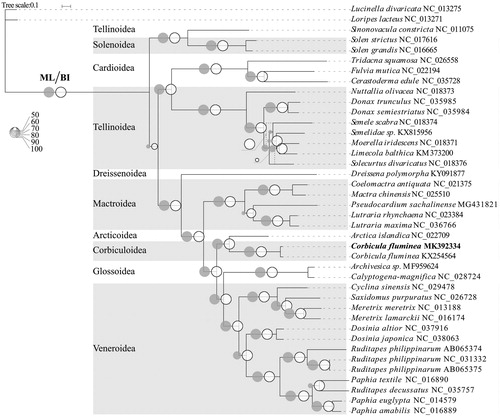
Figure 1. Phylogenetic tree in Veneroida using the complete mitochondrial PCGs sequences. The complete mitogenome is downloaded from GenBank and the phylogenic tree is constructed by maximum-likelihood (ML) and Bayesian inference (BI) method. The bootstrap values and posteriori probability were presented as the proportion of gray and white circles, respectively. The dotted lines indicated the structure of the BI tree differing from that of ML tree. The genomic sequences obtained in this study were shown by bold type.