
Figures & data
Figure 1. Christella dentata growing in its natural habitat. (a) The whole plant; (b) rhizome; (c) leaf. The photo was taken and redacted by SYL and XZ at Mount Jiulian in Longnan County, Jiangxi Province (24°0′37.8″N, 114°0′34.2″E).
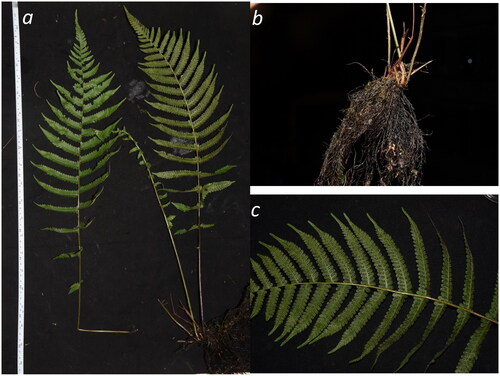
Figure 2. Chloroplast genome map of Christella dentata. From the center outward, the first track shows the dispersed repeats, in which the Forward (D) and Palindromic (P) repeats are connected with red and green arcs. The second track shows the long tandem repeats as short blue bars. The third track shows the short tandem repeats or microsatellite sequences as short bars with different colors that correspond to their repeat unit size: Black: complex repeat; green: repeat unit size = 1; yellow: repeat unit size = 2; purple: repeat unit size = 3; blue: repeat unit size = 4; orange: repeat unit size = 5; red: repeat unit size = 6. The small single-copy, inverted repeat, and large single-copy regions are shown on the fourth track. The GC content along the genome is plotted on the fifth track. The genes are shown on the sixth track, while the optional codon usage bias is displayed in the parenthesis after the gene name. Genes are color-coded by their functional classification (bottom left corner), while the transcription directions for the inner and outer genes are clockwise and anticlockwise, respectively.
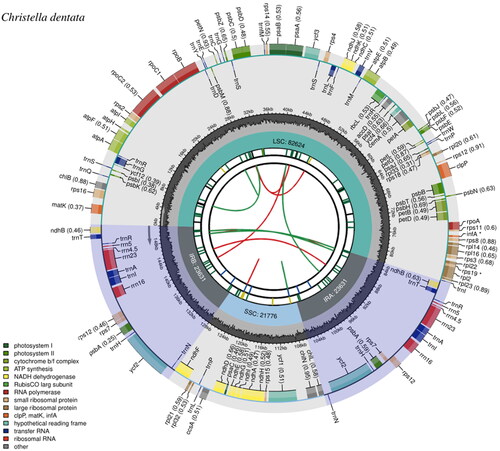
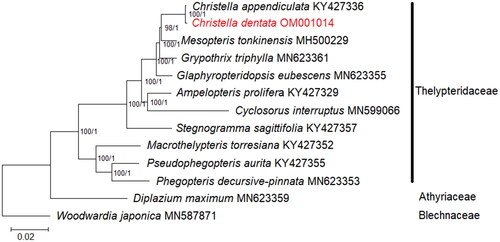
Figure 3. Phylogenetic analysis based on concatenated 82 shared unique CDS in the plastid genome of 13 species of Thelypteridaceae. Diplazium maximum (Athyriaceae; GenBank accession number: MN623359) and Woodwardia japonica (Blechnaceae; GenBank accession number: MN587871) are included as outgroups (Wei et al. Citation2017; Liu et al. Citation2020; Ramekar, Choi, Kwak, et al. Citation2020). Values of bootstrap support and posterior probability for each branch nodes are as indicated.
Supplemental Material
Download JPEG Image (185.9 KB)
Supplemental Material
Download JPEG Image (164.7 KB)
Supplemental Material
Download TIFF Image (1.5 MB)Data availability statement
The plastid genome sequence data in this study are openly available in GenBank of NCBI at https://www.ncbi.nlm.nih.gov/ with the accession number OM001014. Raw sequencing reads used here have been deposited in the SRA database of NCBI under accession number SRR17418362. The associated ‘BioProject’ and ‘Bio-Sample’ numbers are PRJNA793617 and SAMN24566055, respectively.