
Figures & data
Figure 1. The characteristic images of R. leptacantha (shrubs spreading, dioecious; leaves alternate, small, narrow; flowers yellow-green, unisexual, 4-merous; drupes brown, subglobose. In this study, these pictures were taken by the author from Guiyun Huang). (A) Flowers, (B) Fruits. The voucher specimen (No. 210503011; 110°25′18.60′′E, 31°01′536.00′′N) was deposited in the herbarium of Yangtze River Biodiversity Research Center. (Jinhua Wu, [email protected]).
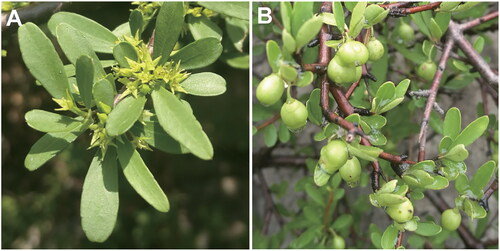
Figure 2. The genome map of R. leptacantha. Circular representation of the R. leptacantha chloroplast genome, showing the clockwise (genes inside the circle) and counterclockwise (outside) transcribed genes. Colors identify genes from the same functional category, following the figure legends. In the inner circle, the dark and light grey bars indicate the guanine + cytosine and adenine + thymine content, respectively. IRa and IRb: inverted repeat regions; LSC: large single copy region; SSC: small single copy.
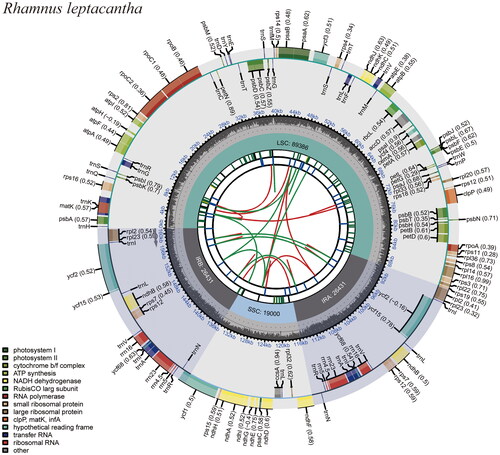
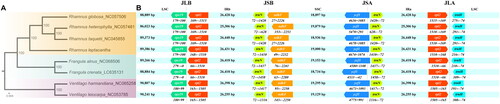
Figure 3. (A) Phylogenetic tree reconstructed by maximum likelihood (ML) method based on 76 protein-coding genes from the eight Rhamnaceae chloroplast genomes. Numbers above the lines represent ML bootstrap values. (B) Comparative analyses of the boundary regions (LSC, SSC, and IR) and adjacent genes among eight chloroplast (cp) genomes. Gene names are shown in boxes, and their lengths in junction sites are displayed below the boxes, plus signs indicate genes located within the boundary, arrows indicate genes located outside the boundary. The following sequences were used: Rhamnus globosa_NC057506, Rhamnus heterophylla_NC057481, Rhamnus taquetii_NC045855, Frangula alnus_NC068506, Rhamnus crenata_LC635131, Ventilago harmandiana_NC065258, Ventilago leiocarpa_NC053785, 7 previously published species combined with our newly generated species Rhamnus leptacantha for a total of 8 species.
Supplemental Material
Download TIFF Image (2.3 MB)Supplemental Material
Download TIFF Image (3.5 MB)Supplemental Material
Download TIFF Image (4.6 MB)Data availability statement
The genome sequence data that support the findings of this study are openly available in GenBank of NCBI at (https://www.ncbi.nlm.nih.gov/) under the accession no. OR346919. The associated BioProject, SRA, and Bio-Sample numbers are PRJNA998250, SRR25412703, and SAMN36701180, respectively.