Figures & data
Figure 1. Remotely sensed wintertime methane ebullition flux (g CH4 m−2 yr−1) for 5,143 Alaskan lakes as estimated by Engram, Walter Anthony, and Meyer (Citation2020) for five study regions: (A) Atqasuk, (B) Barrow Peninsula, (C) Fairbanks, (D) Seward Peninsula, and (E) Toolik.
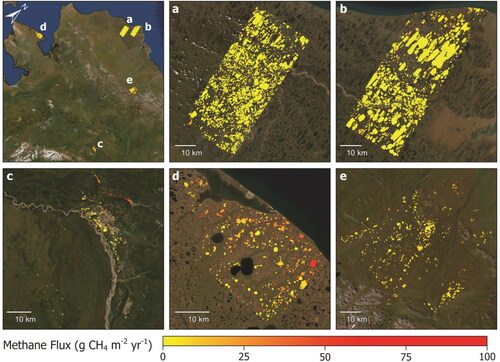
Table 1. Study site characteristics and ebullitive fluxes
Table 2. Selected representative variables with sources, variable descriptions, shorthand variable names, data formats, and spatial resolutions
Figure 2. Schematic for lake wetland fraction (LWF) calculation. (A) Engram, Walter Anthony, and Meyer (Citation2020) vector lake outline with a 100-m buffer and J. A. Wang et al. (Citation2019) water class. (B) 100-m buffer and J. A. Wang et al. (Citation2019) water, littoral, bog, and fen classes. (C) 100-m buffer and J. A. Wang et al. (Citation2019) water and combined wetlands classes. The two classes within the buffer in (C) are used to calculate LWF.
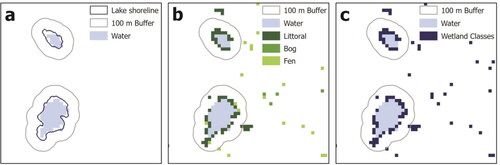
Table 3. Best performing individual linear regression models for representative variables from each data set, ordered by adjusted R2, which accounts for the number of observations (n)
Table 4. Multiple linear regression model results ordered by adjusted R2 including the additional test model with region
Figure 3. Methane ebullitive flux versus (A) lake wetland fraction, and (B) lake area with corresponding individual regression models.
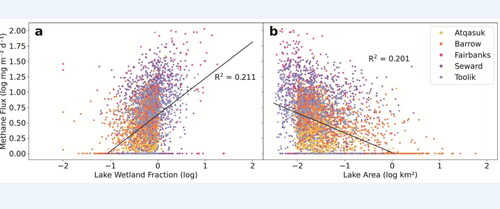
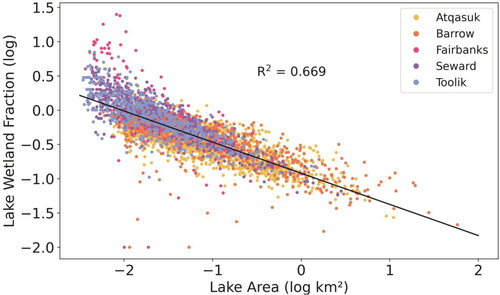
Figure 4. Observed linear relationship between lake area and lake wetland fraction.