Figures & data
Figure 1. Explanatory illustrations of the MF and the VSF. The bold white arrows in the sub-figures point in the flow direction. (a) Photo of a MF located on the Nethe river near Höxter, Germany. Source: Stamm et al. (Citation2015a); (b) Photo of a VSF located on the Mosel river near Koblenz, Germany; (c) Aerial side view of the MF CAD model; (d) Aerial side view of the VSF 30°CAD model.
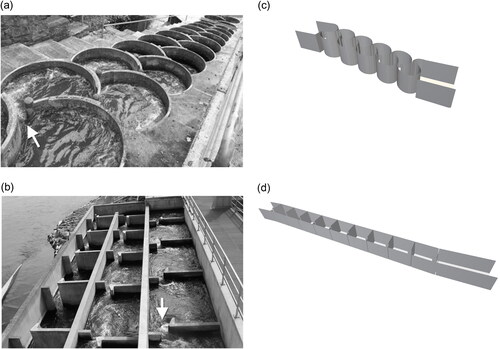
Figure 2. Display of two main flow patterns within VSF basins. (a) Flow pattern 1, where the main flow goes straight from the upstream to the downstream-located slot; (b) Flow pattern 2, with a redirected main flow to the opposite side of the wall.
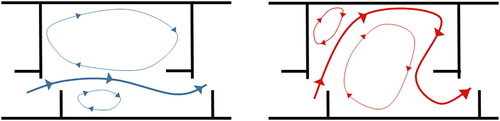
Figure 3. Illustration of the different basin designs constructed with slot width of b = 0.20 m. (a) Dimensions of the MF constructed, with the method to obtain a basin angle of γ = 65° according to Stamm et al. (Citation2015a); (b) Overall dimensions of the VSF basin with varying length at the diversion baffle. Measurements in unit meters.

Figure 4. Sketch of the correlation between the relevant fish size, eddy diameter and cell size. More cells describe a connected region of fluid (upper right eddy), improving its identification and visualisation. Eddies smaller than the cell size will not be captured and thus will not be relevant in the evaluation.
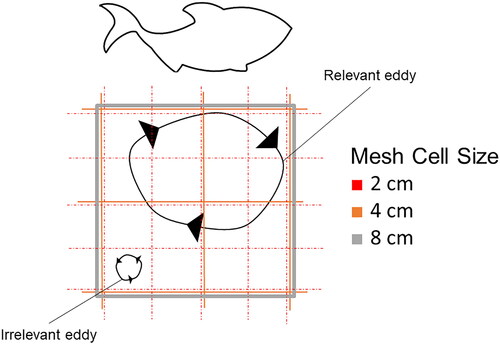
Figure 5. Horizontal 2D-slice through the domain, showing an excerpt of the constructed mesh in basin 5 and a magnification near the slot region (marked area) for the MF (a) and VSF 45° (b).
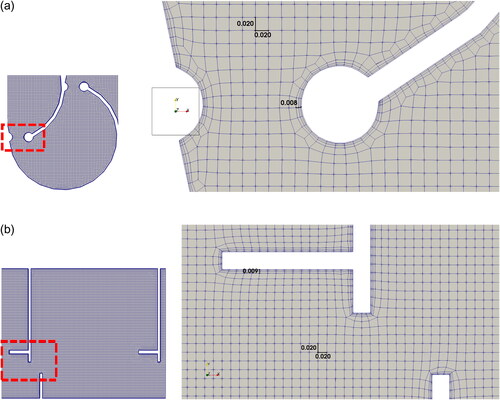
Table 1. Boundary conditions applied in OpenFOAM for all simulation faces.
Figure 6. Schematic visualisation of the VoF interface in a Cartesian mesh. Cells filled with water show α = 1, with air α = 0. Values between 0 < α < 1 are partially filled and define the water surface.
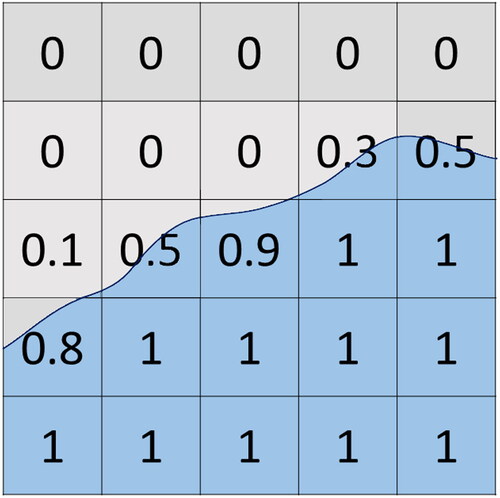
Figure 7. Transect placement inside the MF and VSF fishways. The probe distance is defined in both cases from the right side wall to the centre point/left wall of the basin. (a) Transect placement inside the MF basins; (b) Transect placement inside the VSF basins.
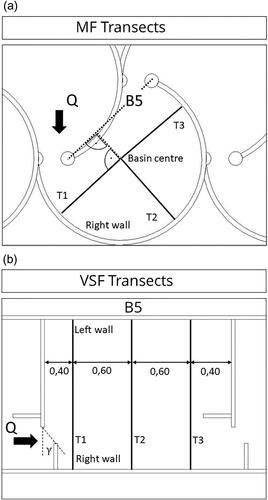
Figure 8. Slice through basin 5 visualising the flow pattern and velocities of the MF (a), VSF 30° (b) and VSF 45° (c). All sub-figures show a snapshot at the simulated time step
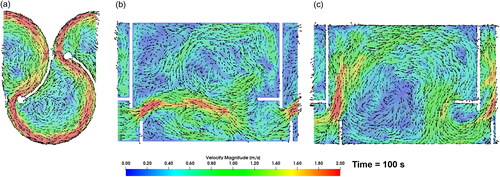
Figure 9. Boxplots of the velocity magnitude for basin 5 in the MF (a), VSF 30° (b) and VSF 45° (c).
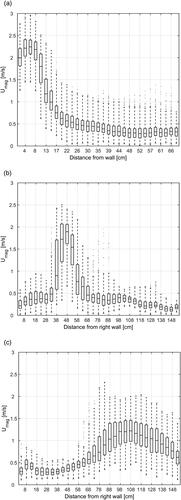
Figure 10. Boxplots of the vorticity magnitude for basin 5 in the MF (a), VSF 30° (b) and VSF 45° (c).
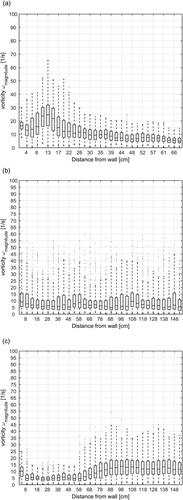
Figure 11. Boxplots of the Q-criterion for basin 5 in the MF (a), VSF 30° (b) and VSF 45° (c).
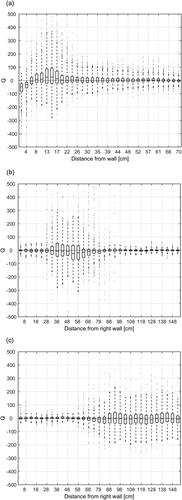
Figure 12. Eddies (grey) extracted from basin 5 under the entire water surface (light blue) of the MF at t = 100 s, shown from an isometric view (orientation axis lower-left corner). The eddy shedding starts directly after the upstream slot and does not change its rotation axis inside the basin.
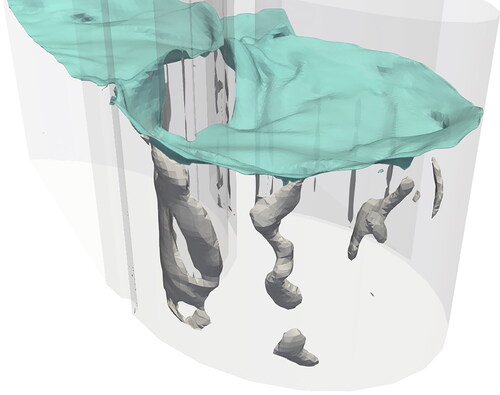
Figure 13. Eddies (grey) extracted from basin 5 under the entire water surface (light blue) of the VSF 30° (a) and VSF 45° (b) at t = 100 s, shown from an isometric view (orientation axis lower-left corner). The eddy shedding starts directly after the upstream slot. The rotational axis changes drastically inside the basin (hairpin vortices).
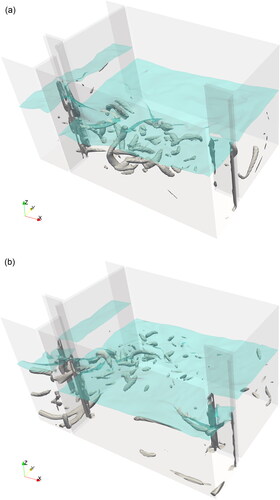
Figure 14. Eddy-Signal-Diagram showing the simulation time (bottom axis), diameter (left axis – line) and location (right axis – dots) of the largest passing eddy on transect 1 in the MF (a), VSF 30° (b) and VSF 45° (c).
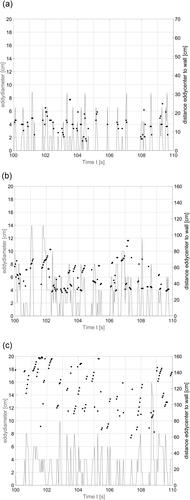
Figure 15. Boxplots of the vorticity z-component for basin 5 in the MF (a), VSF 30° (b) and VSF 45° (c). It can be seen that in the MF boxplot the mathematical sign mainly remains in the positive range. The VSF 30° switches its sign at ≈50 cm away from the right wall and therefore its spin orientation around the z-axis changes.
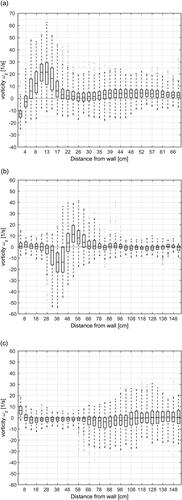
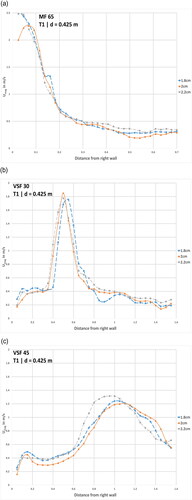
Table 2. Grid convergence study for all fishway simulations with a grid refinement ratio of r ≈ 1.11. It shows the GCI values for GCItotal and GCIcentre, T1 of each simulated fishway. The grids are notated in the index with 1 (fine = 1.8 cm), 2 (original = 2.0 cm) and 3 (coarse = 2.2 cm).
Figure 16. Comparison of the mean velocity magnitude along transect T1 at d = 0.425 m for the grid refinement ratio r ≈ 1.11 in the MF (a), VSF 30° (b)1 and VSF 45° (c).