
Figures & data
Figure 1. Location of Imatra City Brook in south-eastern Finland at the Vuoksi river.
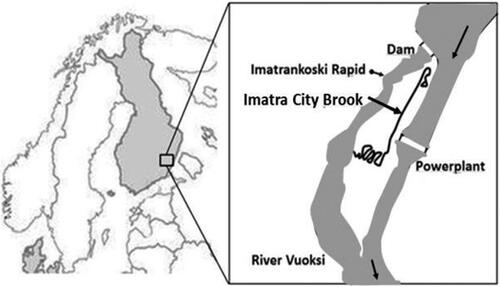
Figure 2. Imatra City Brook with its characteristic areas (study sites shown in .).
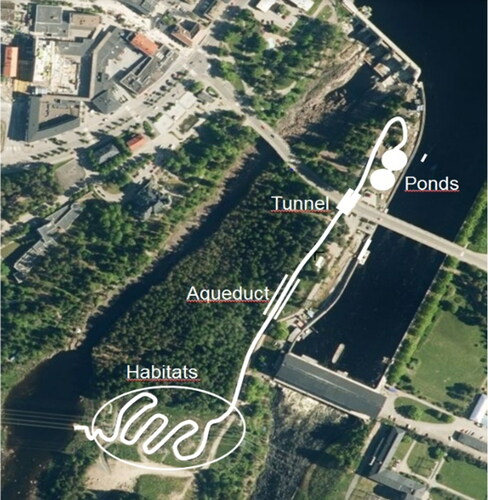
Figure 3. The habitat section was designed with a winding channel and small gradients, with deeper pools in between.
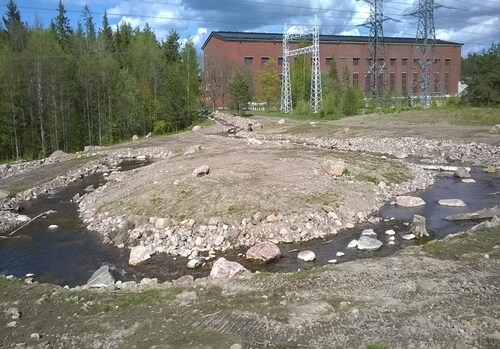
Figure 4. Electrofishing sites 1–5 and macroinvertebrate sites A–D.
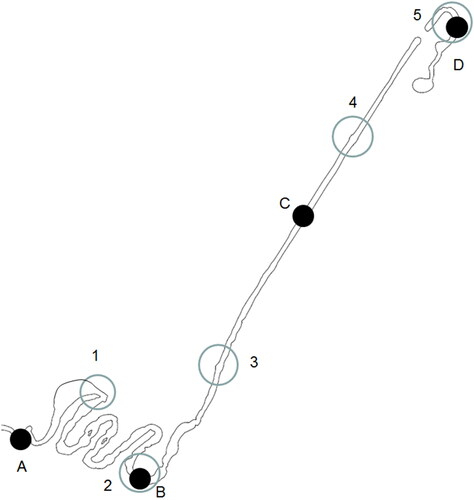
Table 1. Brown trout density estimations for age groups 0+ and 1+ juvenile densities (per 100 m2), according to electrofishing results.
Table 2. Number of macroinvertebrate taxa and individuals in 2016 and 2017, divided in FFG.
Figure 5. Percentages of individuals attributed to FFGs in Imatra City Brook in 2016 (left) and 2017 (right).
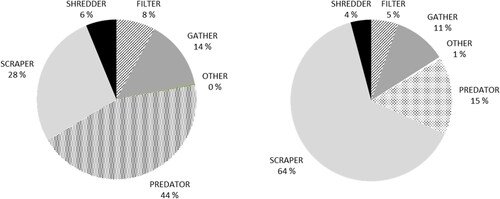
Table 3. Ecological and diversity indices of the macroinvertebrate community in the City Brook in years 2016 and 2017.