
Figures & data
Figure 1. Acetaminophen concentrations (µg/mL) plotted over time (hours after ingestion) – Time either confirmed or estimated on clinical history. Concentrations plotted on a standard Rumack Matthew nomogram with Rumack-Matthew line and treatment line shown. All laboratory studies were performed at a single institution.
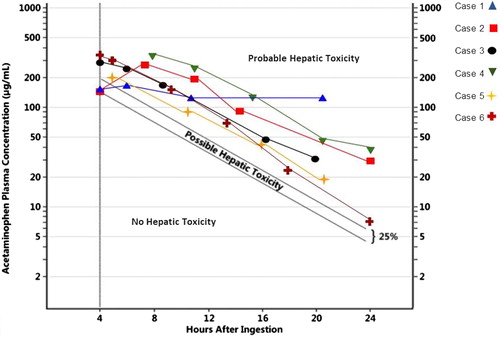
Table 1. AST and ALT over time from estimated or confirmed ingestion.