Figures & data
Figure 1. A graphical illustration of the D'Hondt method. The first two panels show the votes and the seats. The middle panel shows seat shares and vote shares, the fourth panel their ratios, and the last panel shows the seat shares ‘shrunk’ under the vote shares by multiplying them with inverse of the largest ratio, . Data: Gallagher (Citation1991, 35); votes in thousands.
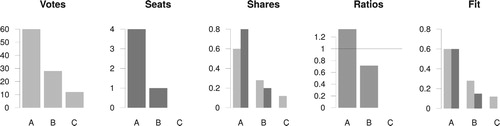
Figure 2. The fraction of residual votes π as a function of the D'Hondt index δ (shown on logarithmic scale) for .
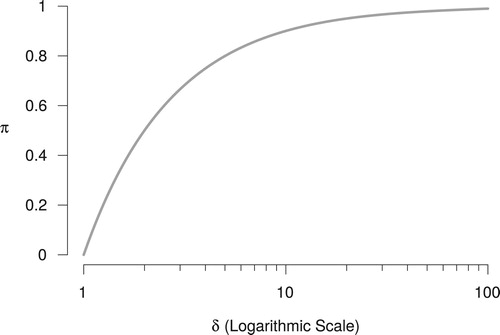
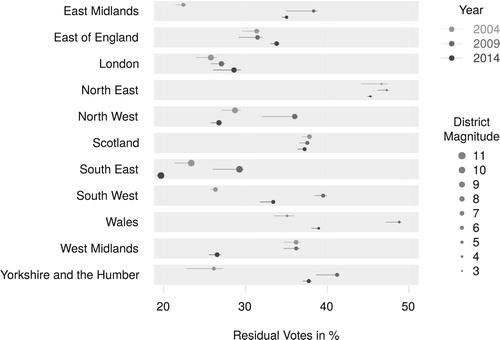
Figure 3. Residual fractions of valid votes by constituency. Each plot shows the values for all constituencies, and highlights one. Point size indicates the number of seats (district magnitude).
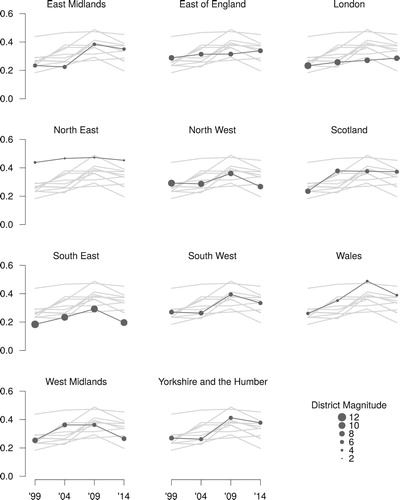
Figure 4. Residual fractions by party, year, and constituency. Histograms show total vote shares of the parties by year. Constituency area proportional to valid votes. Cartograms with Eurostat (Citation2017) and Jeworutzki (Citation2016). Shetland and Orkney added to the main area of Scotland. Table B.2 in the appendix reports the vote fractions.
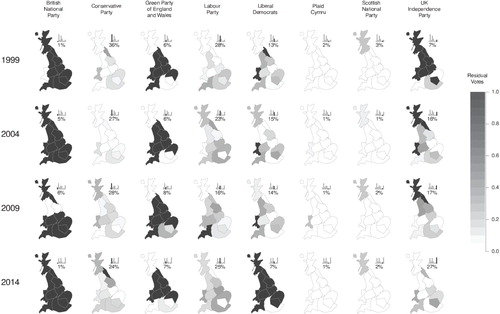
Figure 5. Votes won and unrepresented fractions by party and year. Diagonal lines show OLS slopes for all parties except SNP and PC.
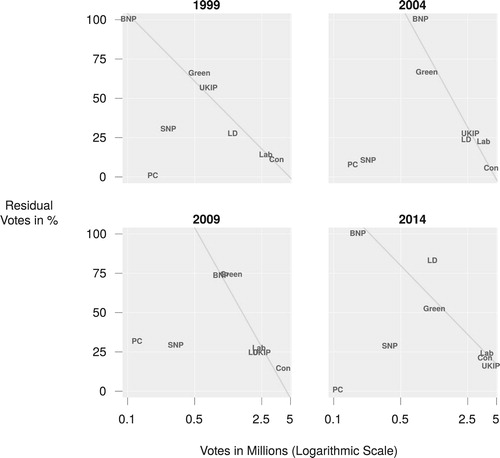
Figure 6. Residual vote fractions and intervals between the worst case and best case scenarios under the observed rates of invalid votes. Invalid rates in 1999 are unavailable.