
Figures & data
Table 1. Frequency of posts containing elements of populist or crisis-related messages.
Figure 1. Shares of populist and crisis-related messages by party.
Note. The hatched parts represent the proportion of posts combining both populist and crisis-related messages.
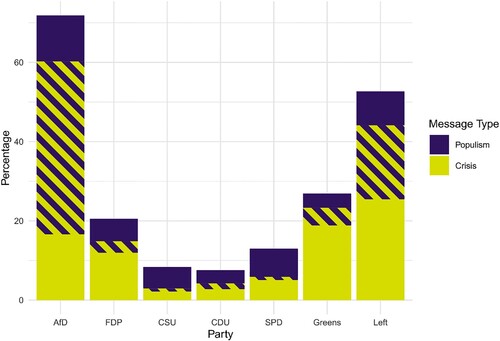
Figure 2. Predicted probabilities for populist, crisis-related and populist + crisis-related messages by party.
Note. Based on logit models (Model I- Model III) in in Appendix.
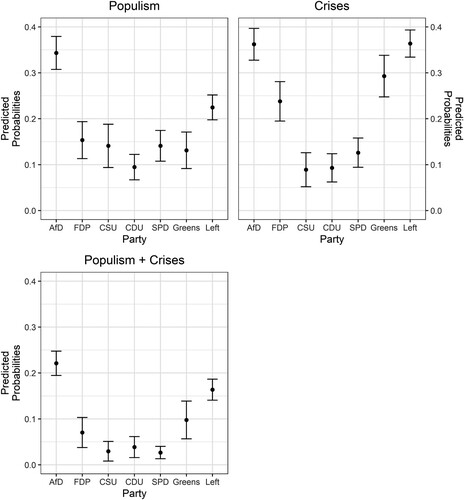
Table A1. Codebook categories for populist and crisis-related messages.
Table A2. Shares of populist and crisis-related messages.
Table A3. Results of logistic regression predicting populist and crisis-related messages.
Supplemental Material
Download PDF (1.1 MB)Supplemental Material
Download MS Word (730.4 KB)Data availability statement
Raw data were generated by accessing text data from Facebook using the statistical software R. Derived data supporting the findings of this study are available from the corresponding author Benjamin Schürmann on request.