Figures & data
Figure 1. Location map of the study area.
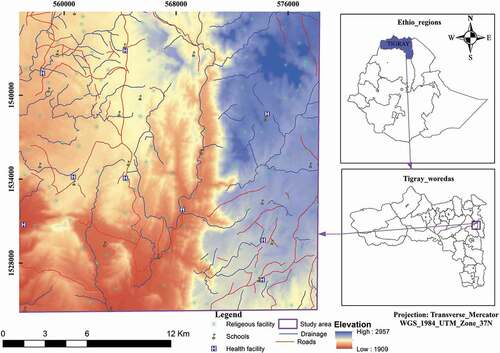
Figure 2. Geological map of Negash area.
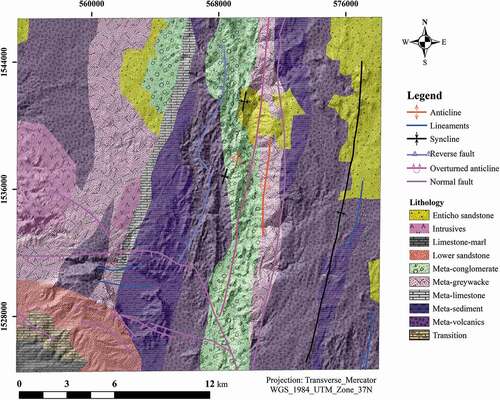
Table 1. Performance characteristics of satellite data.
Figure 3. Flowchart of the Methodology.
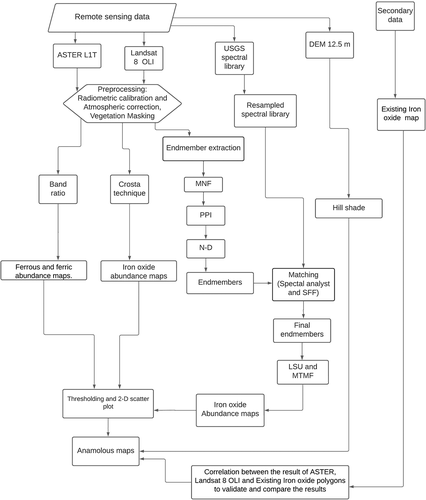
Figure 4. NDVI map generated from Landsat 8 OLI (a), and ASTER (b).
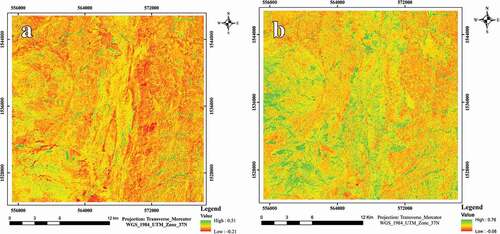
Table 2. Threshold, confidence level and area mapped using all techniques.
Figure 5. Ferrous iron anomaly map generated from Landsat 8 OLI (a), ASTER (b), and ferric iron anomaly generated from Landsat 8 OLI (c), and ASTER (d).
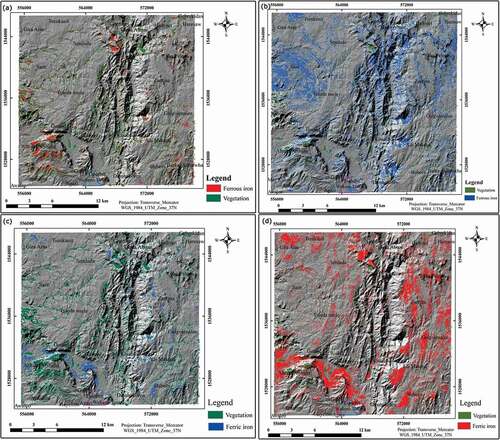
Figure 6. Laterite anomaly map generated from ASTER band ratio (a), anomaly map generated from PC4 Landsat 8 OLI (b), ASTER PC4 (c), and (d) final endmembers extracted from (a) ASTER, and (b) Landsat 8 OLI.
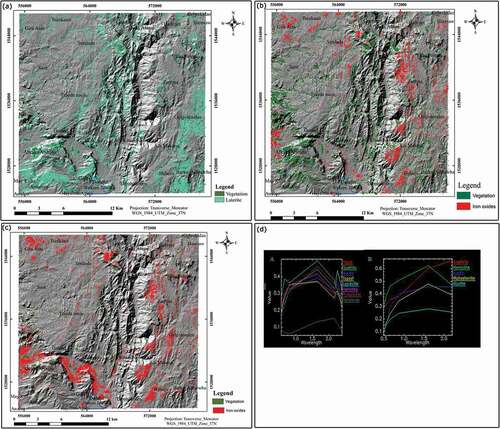
Table 3. ASTER bands 1, 2, 3 and 4 eigenvector loadings.
Table 4. Landsat bands 2, 4, 5 and 6 eigenvector loadings.
Table 5. MNF eigen values of ASTER and Landsat 8 OLI.
Table 6. Unknown and reference spectral curve matching values of ASTER.
Table 7. Unknown and reference spectral curves matching values of Landsat 8 OLI.
Figure 7. ASTER unmixing (a) Goethite anomaly and (b) Hematite anomaly, and scatter plots showing high MF and low infeasibility goethite and hematite of ASTER (c), and Landsat 8 OLI (d).
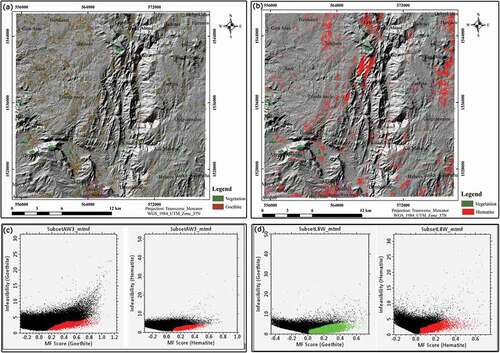
Figure 8. ASTER MTMF (a), Goethite anomaly and (b) Hematite anomaly and Landsat 8 OLI MTMF (c) Goethite anomaly and (d) Hematite anomaly.
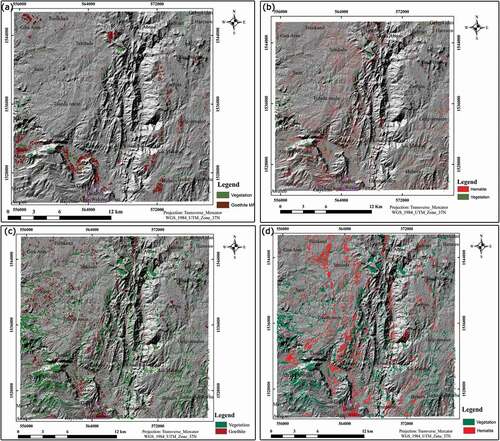
Figure 9. Graphs showing correlation b/n results obtained from pixel-level image processing of Landsat 8 OLI and ASTER (a) and correlation b/n results obtained from Landsat OLI, and ASTER MTMF (b).
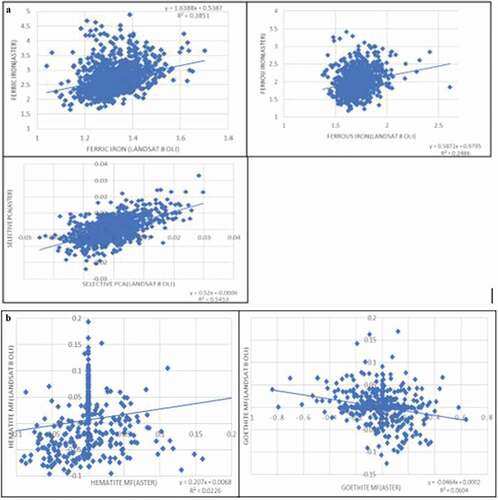
Figure 10. Ratio of anomalous areas overlay on polygons of the existing iron oxides (a), and selective PCA results overlay with existing iron oxide polygons (b).
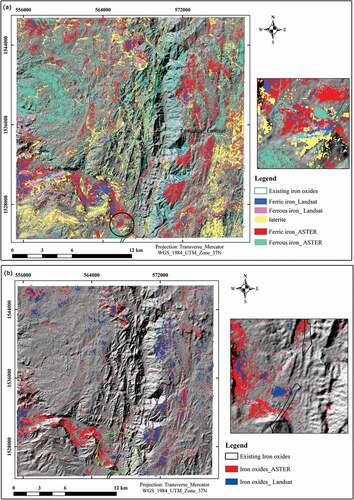
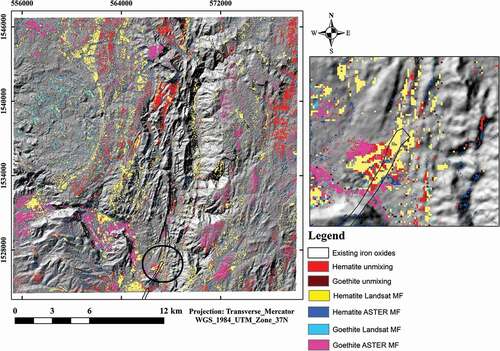
Figure 11. Unmixing and MTMF results overlay on existing iron oxide polygons.