
Figures & data
Figure 1. Visualization of characteristic aphid probing activities derived from Electrical Penetration Graphs (EPGs) technique. The illustration is composed of representative samples from EPG recordings in the present study. The images for panels a, c and d were obtained from EPG recordings of Aphis fabae on Vitis amurensis and the image for panel b was obtained from EPG recording of Myzus persicae on V. amurensis. “np” – no probing, “C” – pathway activity in apoplast with intracellular punctures, “E1e” – watery salivation into apoplast, “E1” – watery salivation into sieve elements, “F” – derailed stylet activities in apoplast, “G” – sap ingestion from xylem vessels.
Figure 2. Temporal changes in probing behavior of Aphis fabae and Myzus persicae on grapevines Vitis amurensis, Vitis riparia and Vitis vinifera. G = xylem sap ingestion; E1e = watery salivation into apoplast; F = unidentified difficulties in penetration, E1 = watery salivation into sieve elements, E2 = phloem sap ingestion, C = pathway, np = no-probing. “Total” = proportion of all aphid activities during 8-hour EPG monitoring.
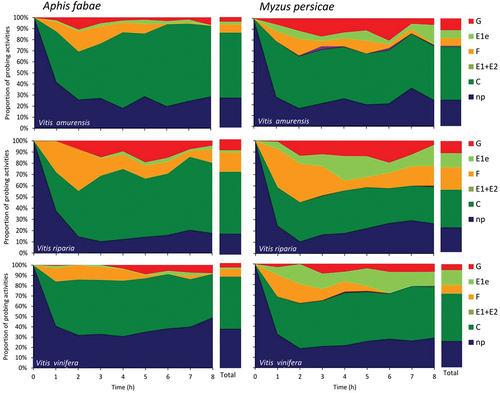
Table I. Probing behavior of Aphis fabae on Vitis amurensis, Vitis riparia and Vitis vinifera.
Table II. Probing behavior of Myzus persicae on Vitis amurensis, Vitis riparia and Vitis vinifera.
Figure 3. Proportion of Aphis fabae and Myzus persicae that reached vascular tissues, phloem and xylem, in the leaves of Vitis amurensis, Vitis riparia and Vitis vinifera.
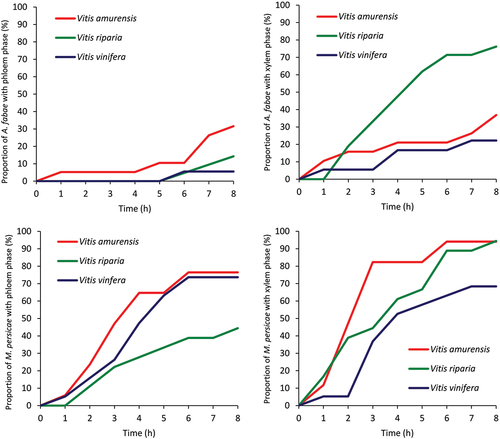
Figure 4. Proportion of phenolic compounds analyzed in grapevines Vitis amurensis, V. riparia and V. vinifera.
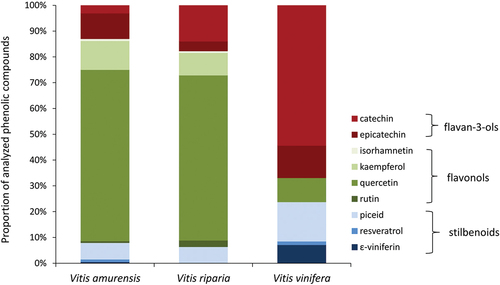
Figure 5. Representative samples of transverse sections of grapevine leaves at main veins of the leaves of Vitis amurensis, V. riparia and V. vinifera observed under light microscope Carl Zeiss Axio Imager 2 coupled with Zeiss AxioCam ERc 5s and ZEN Lite computer programme (400x magnification). 1 – adaxial epidermis; 2 – collenchyma; 3 – parenchyma; 4 – vascular bundle sheath; 5 – phloem; 6 – xylem.
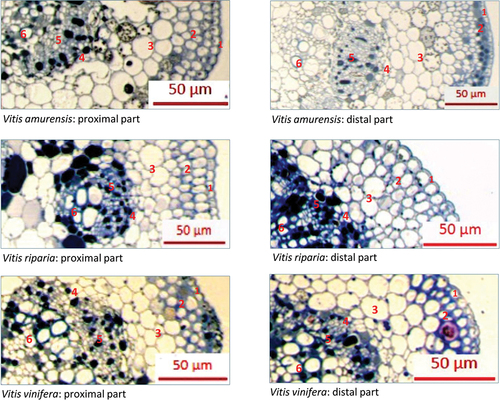
Table III. Anatomical measurements of leaves of Vitis amurensis, Vitis riparia and Vitis vinifera.