Figures & data
Figure 1. Immunolocalization of TLR1 in G. mellonella hemocytes: (a) immunodetection of TLR1 (performed as described in materials and methods section), (b) flow cytometry data given as dot plots (SSC versus FSC); green indicates cells containing TLR1. F24 indicates larvae sampled immediately after 24–hour exposure to fungal infection; F48 indicates larvae sampled 24 hours after 24–hour exposure. Scale bars = 25µm.
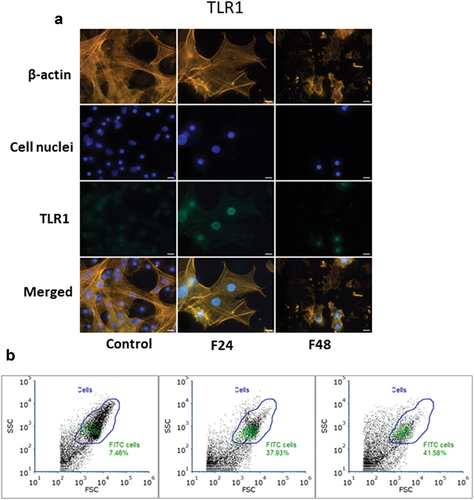
Figure 2. Immunolocalization of TLR2 in G. mellonella hemocytes: (a) immunodetection of TLR2 (performed as described in materials and methods section), (b) flow cytometry data given as dot plots (SSC versus FSC); green indicates cells containing TLR2. F24 indicates larvae sampled immediately after 24–hour exposure to fungal infection; F48 indicates larvae sampled 24 hours after 24–hour exposure. Scale bars = 25µm.
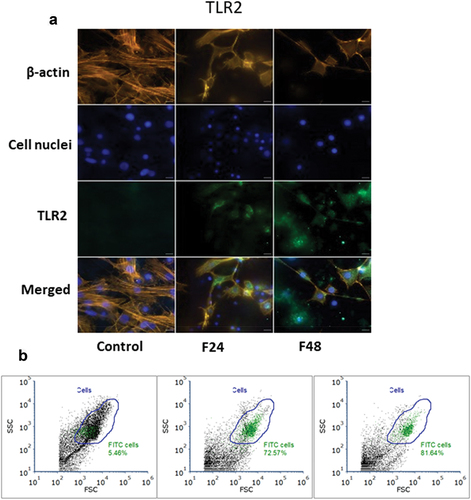
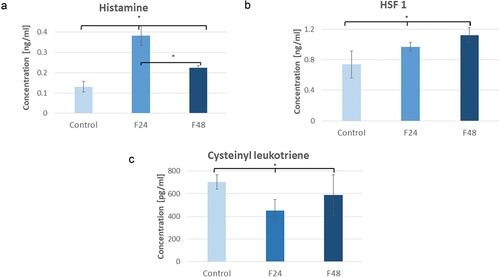
Figure 3. Changes of concentration of histamine (a), HSF1 (b) and cysteinyl leukotriene (c) in G. mellonella hemolymph after fungal infection, determined by ELISA (Enzo Life Sciences). Data are expressed as mean ± SD; *p < 0.05. All of the raw data are attached in the Supplementary Table 1–Raw data.