
Figures & data
Table 1. Datasets for classification, detection, and segmentation of the vehicle damage.
Figure 1. Architecture overview of the detection system based on YoLo approach.
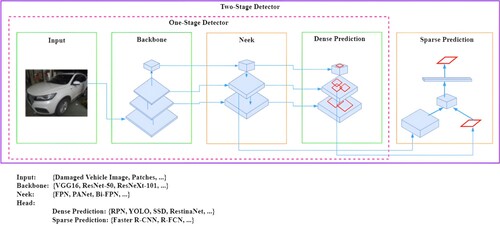
Figure 2. Mask R-CNN model architecture.
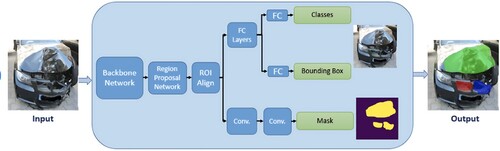
Figure 3. Comparison of VehiDE statistics and other datasets.
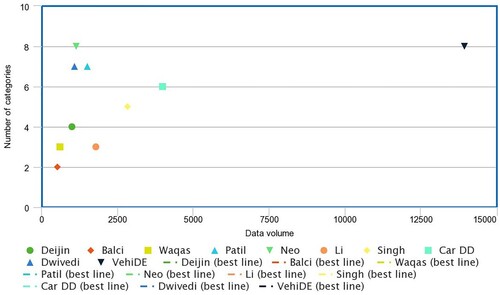
Figure 4. Samples of annotated images in the VehiDE dataset. The first row presents the images of damaged vehicle; the second row shows the annotated labels; the last row demonstrates the masks of vehicles.
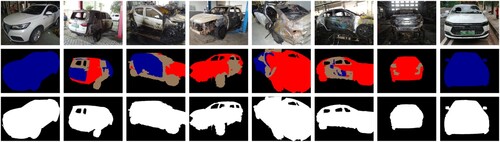
Figure 6. Visual comparison of diverse Salient Object Detection (SOD) methods.
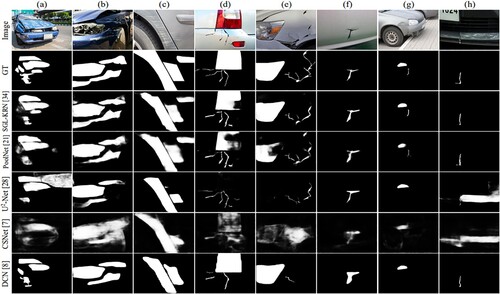
Figure 5. Mask R-CNN network with parallel semantic segmentation branch.
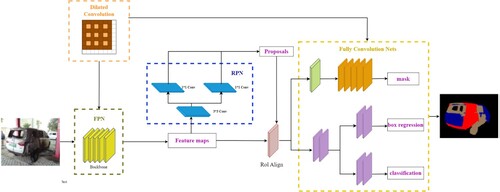
Table 2. SOD method hyper-parameters. denotes the interval between the ith and jth epochs.
Table 3. Results of CSNet, -Net, PoolNet, and SGL-KRN's quantitative salient object detection.
Table 4. Results of SGL-KRN's quantitative salient object detection for each class.