Figures & data
Figure 1. Simulation environment (setting and communication).
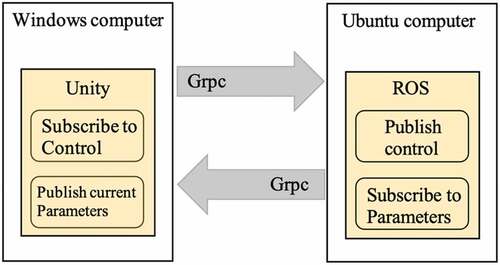
Figure 2. Comparing the loading time between HTTP/1.1 and HTTP/2 (De Saxcé, Oprescu, and Chen Citation2015).
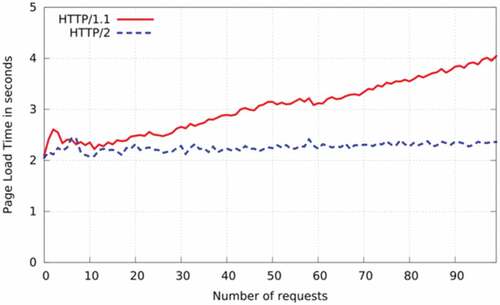
Figure 3. Vessel model with coordinate systems (base_link, navigation, base_scan) in ROS RVIZ, and Unity (NJORD Citation2021).
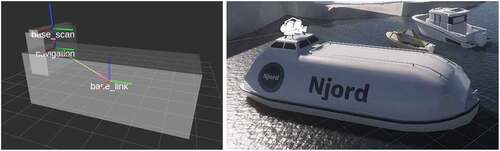
Figure 4. Coordinates transformation.
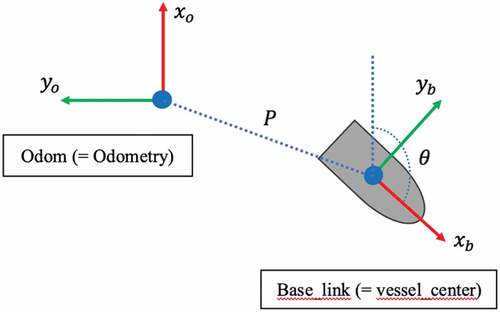
Figure 5. Constructed coordinates in the model.
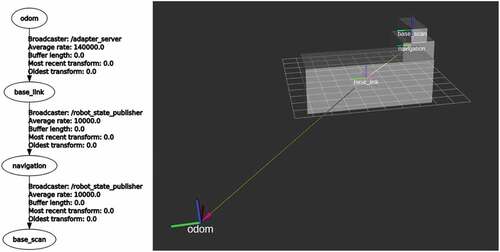
Figure 6. Communication diagram by node while mapping (RQT).
Figure 7. Schematic diagram of the proposed autonomous navigation with object detection model.
Figure 8. Simulation environment in the unity.
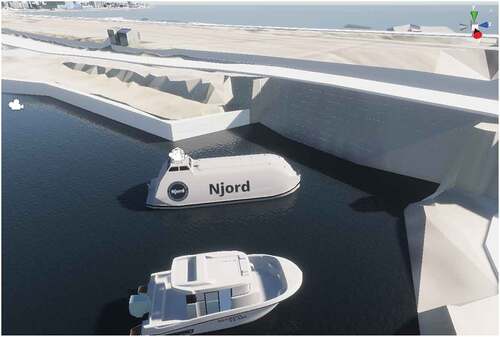
Figure 9. Projected environment by Lidar in ROS RVIZ.
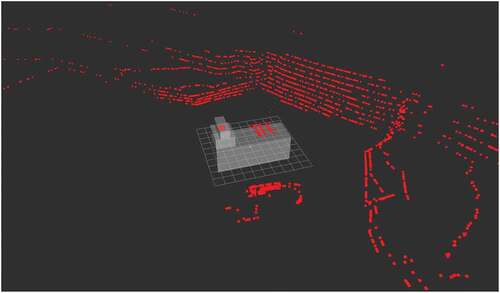
Figure 10. Algorithm for optimal route.
Figure 11. Algorithm for action by object detection.
Figure 12. LabelImg program for labelling and labeled text file (representing class, x position, y position, width, height).
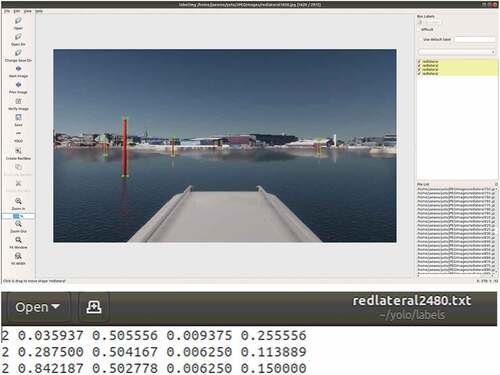
Figure 13. YOLO v4 models – Training process (red line – mAP, blue line – Loss).
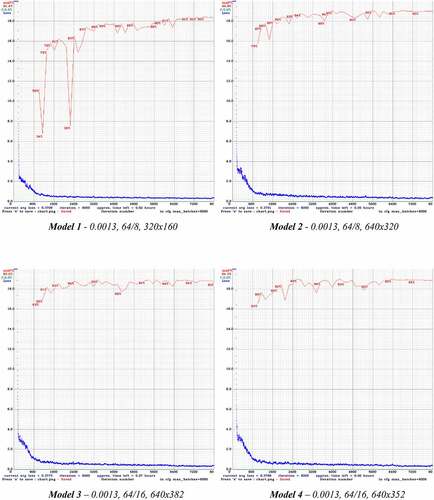
Figure 13. Continued.
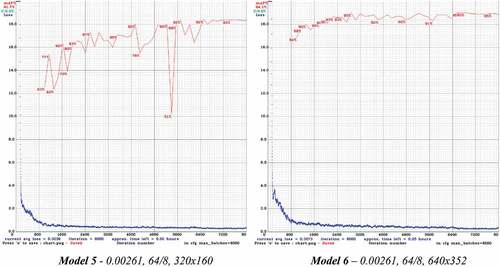
Figure 14. YOLO v4 – tiny models – Training process (red line – mAP, blue line – Loss).
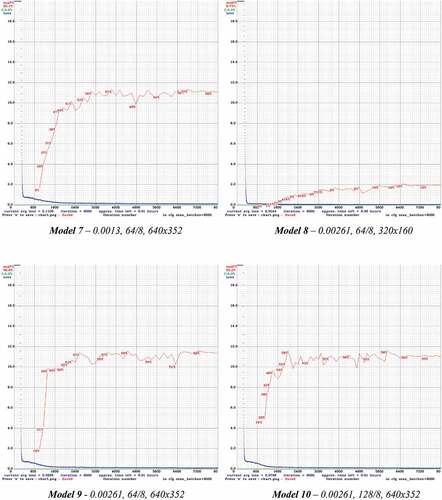
Table 1. Performances of YOLOv4 by Hyperparameter
Table 2. Performances of YOLOv4-tiny by Hyperparameter
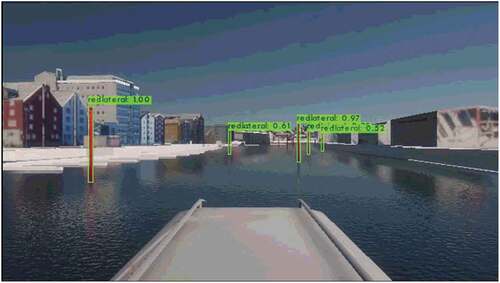
Figure 15. Confidence by lateral.
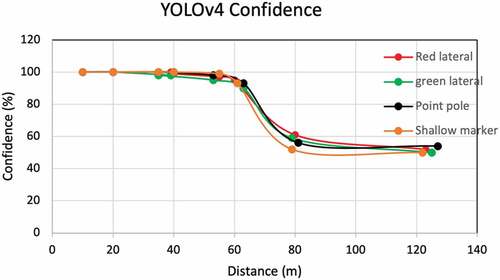
Figure 16. Testing by unseen picture (red lateral: confidence), YOLOv4.