Figures & data
Figure 1. Speech perception (proportion correct) vs. rapid learning of time-compressed speech (rate of improvement over 10 sentences, quantified as the slope of the accuracy vs. sentence number curve). Dashed lines show linear fits. From Rotman et al. (Citation2020), CC-BY-NC
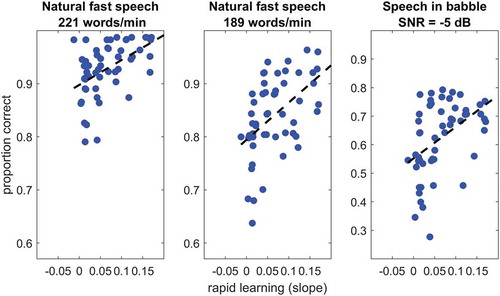
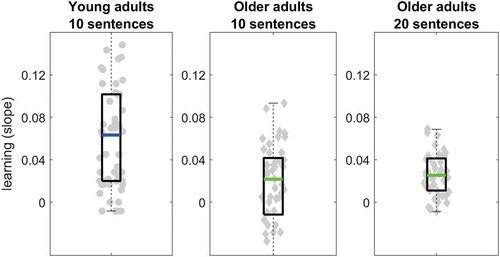
Figure 2. Rapid learning slopes in young and older adults. Box edges mark the 25th and 75th percentiles; lines within each box mark the median; whiskers are 1.5 the inter-quartile range. Grey symbols mark individual slopes. Re-plotted from the data reported in Rotman et al. (Citation2020), CC-BY-NC