
Figures & data
Figure 1. Predicted time courses for mean naming latencies (left) and typical empirical time courses for mean naming latencies (right) for color naming incongruent, congruent, and control spoken color word distractors. The time courses on the left are predicted by the relative pathway strength and the dimension discriminability accounts.
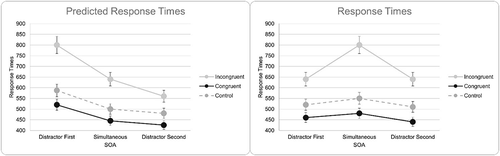
Figure 2. a) Experiment 1 visual targets where participants must name the color of the patch; b) Experiment 1 auditory targets where participants must name the auditory stimulus.
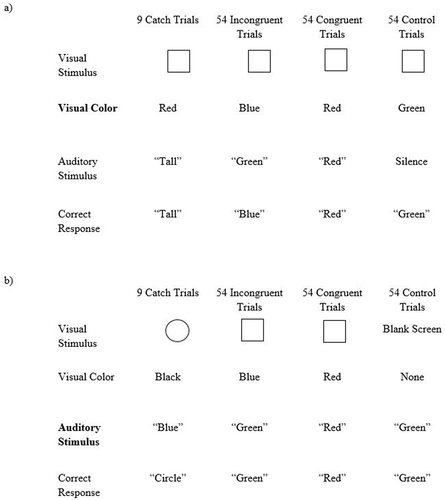
Figure 3. Means of median response times with standard error bars for Experiment 1.
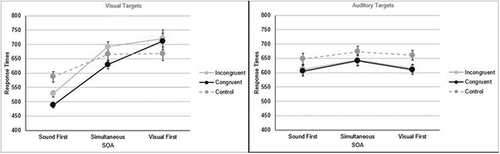
Figure 4. a) Experiment 2 visual targets where participants must name the ink color of the visual targets, b) Experiment 2 auditory targets where participants must name the auditory stimulus.
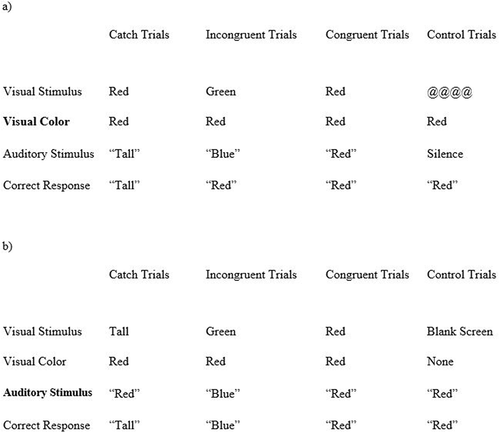
Figure 5. Means of median response times with standard error bars for Experiment 2.
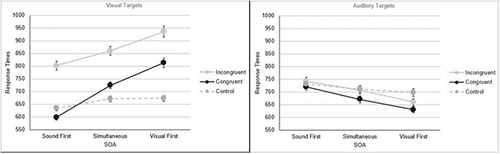
Figure 6. Means of median response times with standard error bars for Experiment 3.
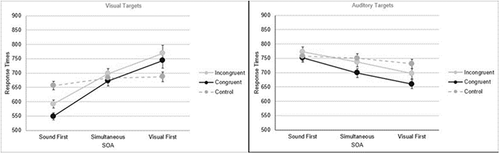
Table A1. Error rate percentages in the catch trials in experiments 1–3
Table B1. Error Rates: Experiment 1
Table B2. Error Rates: Experiment 2
Table B3. Error Rates: Experiment 3