Figures & data
Figure 1. Effect of solution concentration on structure formation (a) 0.10 g/ml, 45° and (b) 0.12 g/ml, 45°(c) 0.13 g/ml, 45° (d) 0.14 g/ml, 45°.
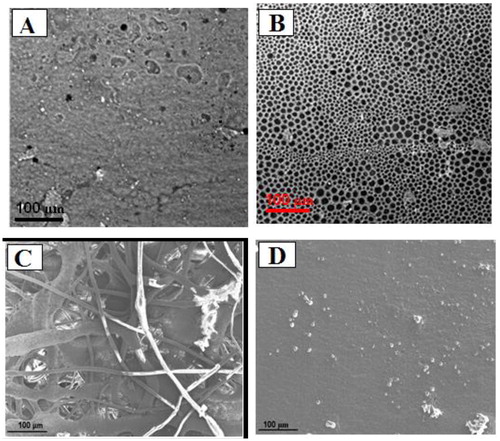
Figure 2. Effect of different parameter combinations (a) 0.11 g/ml, 90° (b) 0.13 g/ml, 30°. N/B: Sample designation represents solution concentration, spinneret angle.
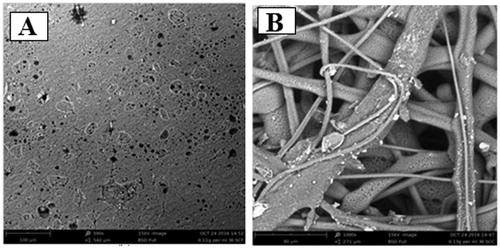
Figure 3. Processed PLA fibres (a) 0.13 g/ml, 90° (b) 0.14 g/ml, 90° (c) 0.12g/ml, 45° (d) 0.12 g/ml, 30°. N/B: Sample designation represents solution concentration, spinneret angle.
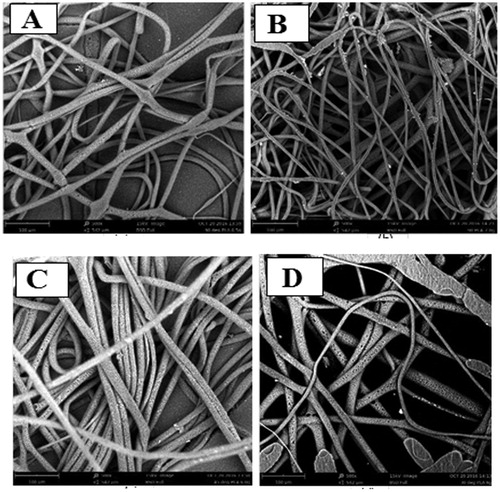
Figure 4. Effect of solution concentration on tensile strength of electrospun fibres.
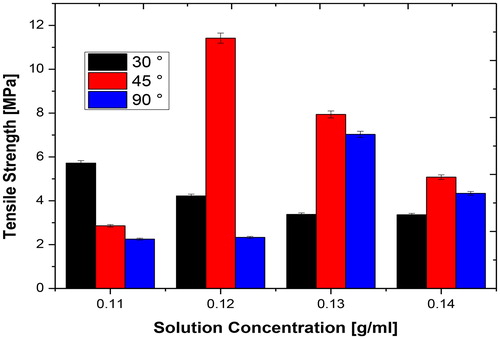
Figure 5. Tensile energy of break of electrospun fibres.
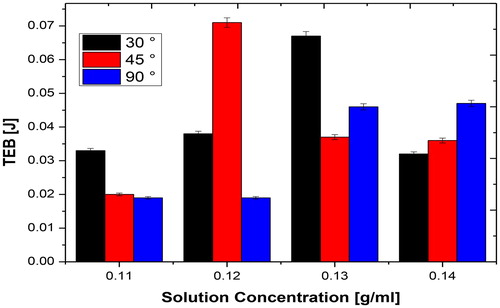
Figure 6. Effect of spin angle on the tensile strength of electrospun fibres.
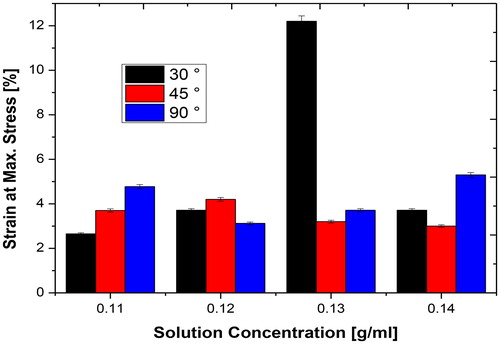
Figure 7. Effect of spin angle on the tensile energy at break of electrospun fibres.
Figure 8. Effect of fibre addition on tensile strength of electrospun fibres.
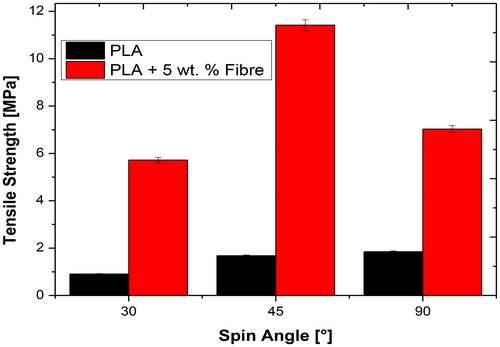
Figure 9. Effect of fibre addition on tensile energy at break of electrospun fibres.
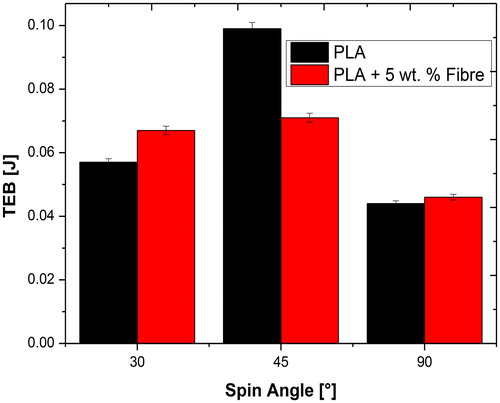
Figure 10. Effect of fibre addition on Strain at maximum load of electrospun fibres.
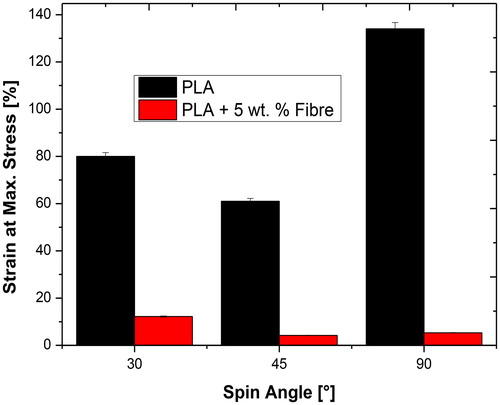
Figure 11. Water absorption of fibres at room temperature.
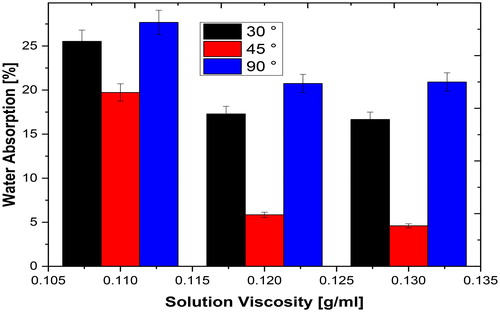
Figure 12. Water absorption behaviour of composites at elevated temperature.
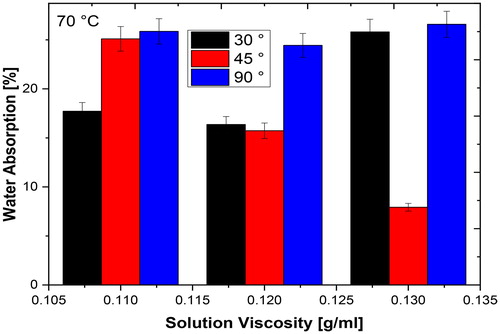
Figure 13. Effect of spinneret angle on thermal degradation.
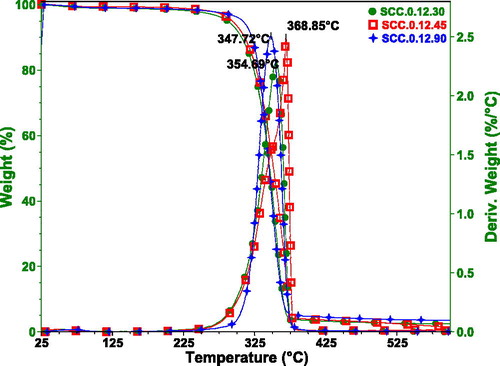
Table 1. Thermal degradation parameters.
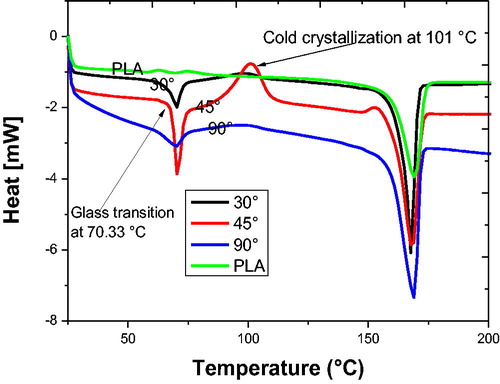
Figure 14. Effect of spinneret angle on thermal properties.