
Figures & data
Figure 1. Field-emission scanning electron microscopy (FESEM) micrographs of fracture surfaces of Mo/6082Al AMCs containing Mo particles: (a) 0 vol.%; (b) 6 vol.%; (c) 12 vol.%; and (d) 18 vol.%. Blue circle: fractured particles; red circle: pull out particles; yellow circle: pull out particle pits. Source: adapted from Selvakumar et al. (Citation2017), with permission from Elsevier.
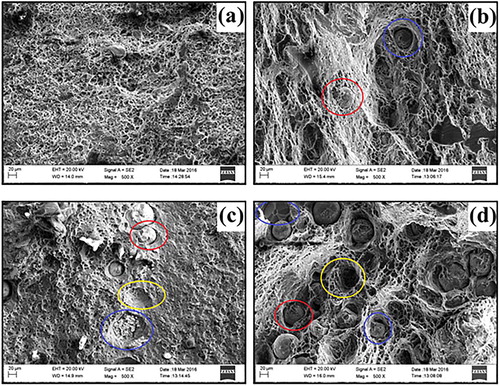
Figure 2. Representative tensile behaviour of as-received Al, SFSPed Al and SFSPed AMCs: (a) tensile curves; (b) comparison of the yield strength, ultimate tensile strength and elongation. Inset shows a tensile test specimen. Source: adapted from Huang et al. (Citation2018), with permission from Elsevier.
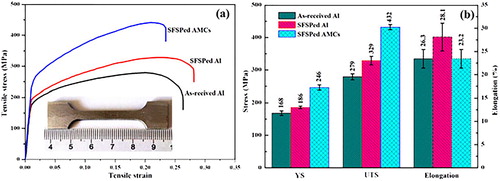
Figure 3. (a) Stress–strain graphs of the composite and FESEM micrographs of fracture surface of: (a) AA6063; and (b) AA6063/12 vol.%. V AMC. Blue arrow: fractured particles; red arrow: pull out particles; yellow arrow: pull out particle pits. Source: adapted from Abraham et al. (Citation2019), with permission from Elsevier.
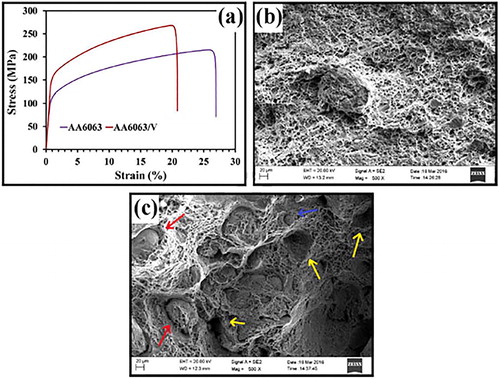
Table 1. Summary of the mechanical response of Al matrix composites developed with metallic-based reinforcements.
Table 2. Tensile properties of the MB15 alloy and composites.
Table 3. Room temperature tensile test results for Mg alloys and ZK51 reinforced composite.
Figure 4. (a) Stress–strain curves in compression test at room temperature of hot extruded Mg composite materials reinforced with Ti particles by using elemental mixture powders. Ti content: 0, 3 and 5 mass%. Source: after Umeda et al. (Citation2010), with permission from Elsevier. (b) Stress–strain curves in tensile test at room temperature of hot extruded pure Mg and Mg–3 mass% Ti composites via a water atomization process, compared with extruded pure Mg using cast ingot. Source: after Umeda et al. (Citation2010), with permission from Elsevier.
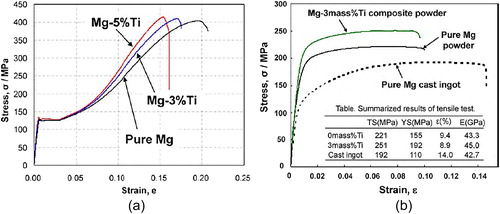
Table 4. Tensile properties of Mg, Mg alloys and Mg-based composites.
Table 5. Summary of the mechanical response of Mg matrix composites developed with metallic-based reinforcements.
Figure 5. Compressive stress strain–curves corresponding to composite specimen with different volume fraction of Ta particles (large irregularly shaped). Source: adapted from Cardinal et al. (Citation2019), with permission from Elsevier.
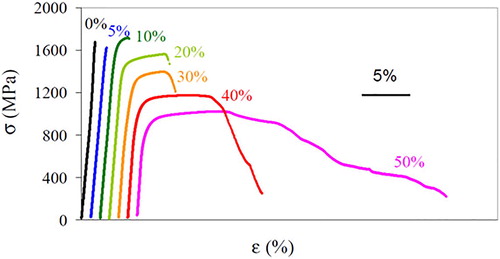
Table 6. Summary of the mechanical response of Cu matrix composites developed with metallic-based reinforcements.
Table 7. Summary of the mechanical response of Zn matrix composites developed with metallic-based reinforcements.