
Figures & data
Figure 1. Diclofenac sodium chemical structure.
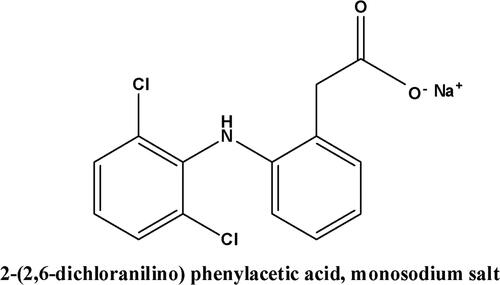
Figure 2. (a) and (b) are SEM images and (c) and (d) are TEM images of MgO.
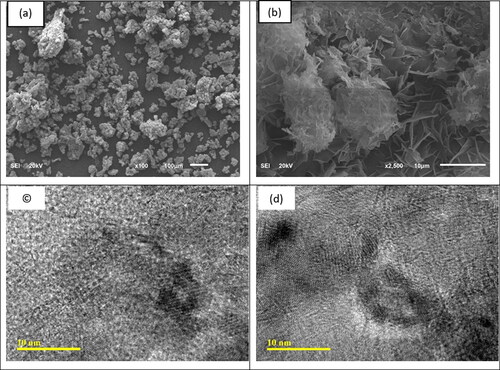
Figure 3. The X-ray diffraction (XRD) patterns of the MgO products synthesized using citric acid as a fuel and subjected to calcination at 800 °C.
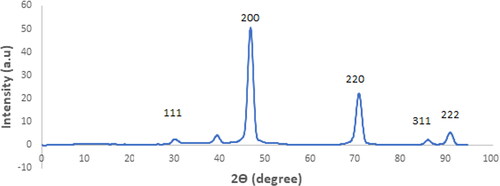
Figure 4. The FT-IR spectra of the MgO nanostructures that were produced and subsequently calcined at 800 °C, using citric acid (a) diclofenac sodium (b) MgO and (c) MgO and diclofenac sodium.
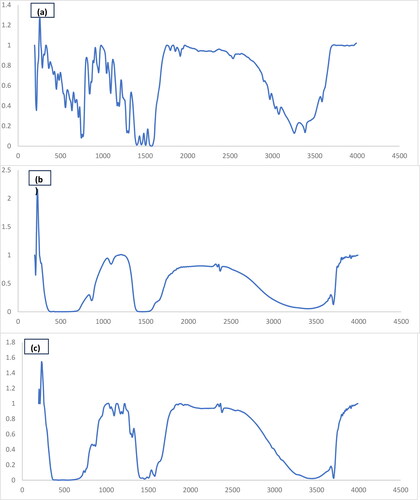
Figure 5. DCF and Cd2+ removal efficiency from aqueous solution using B-nZVI composite (●), activated charcoal (▲), MgO (■) versus time, adsorbent dose 0.1 g, C0100 mg L−1, pH 7, and T = 25 °C.
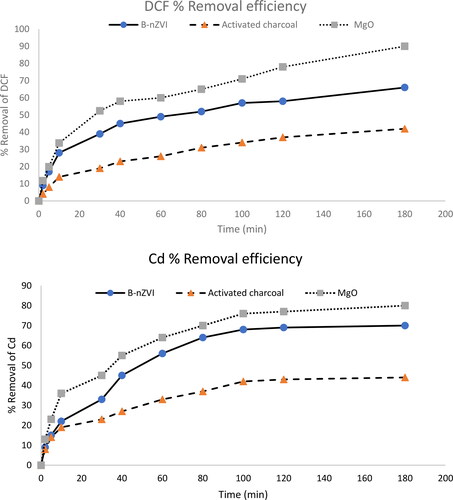
Figure 6. The effect of pH on the removal of DCF and Cd2+ by MgO nanoparticles.
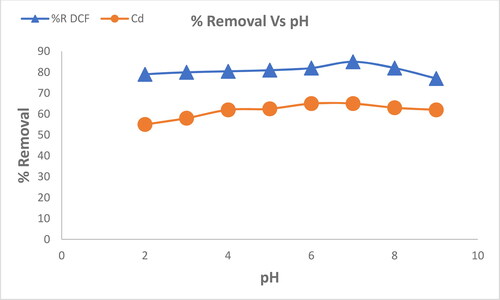
Figure 7. Variables influencing the adsorption efficiency of DCF at a concentration of 100 mg L−1 and Cd2+: MgO nanoparticles dosage at 25 °C and pH 7.
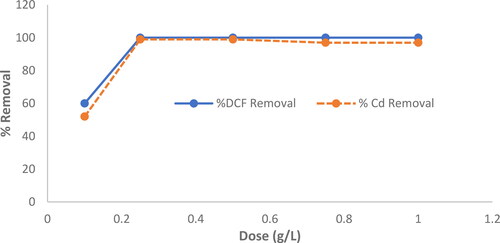
Figure 8. The effect of DCF and Cd2+ initial concentration on the removal efficiency using MgO nanoparticles.
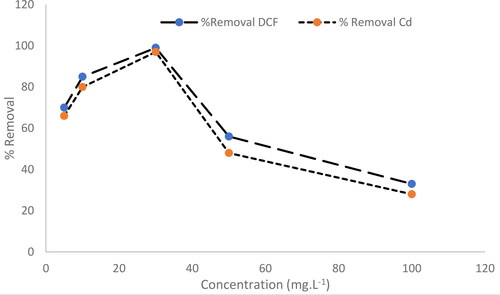
Figure 9. Plotting the pseudo-second-order kinetic parameters for the removal of DCF and Cd2+ by MgO. (●) DCF and Cd2+ (■).
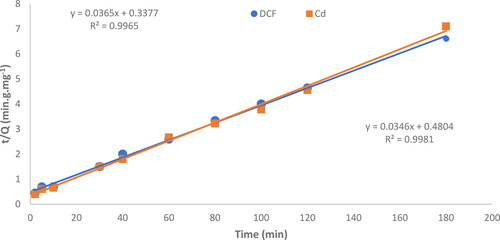
Table 1. The Langmuir isotherm model was utilized to obtain values of K, qmax, and the coefficient of determination (R2) for the removal of both DCF and Cd2+ using the B-nZVI composite at 25 °C.
Figure 10. Linear graphs representing the Langmuir isotherm model for the adsorption of DCF and Cd2+ using MgO nanoparticles and the B-nZVI composite at of 298 K, respectively.
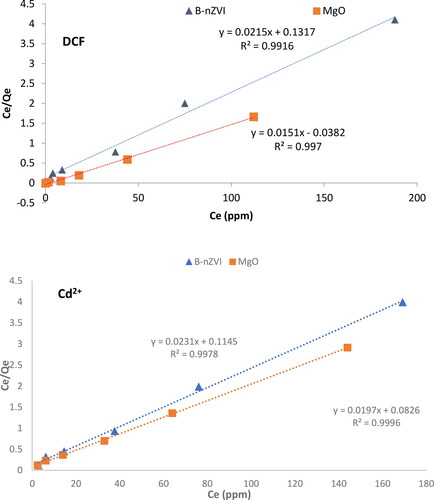
Figure 11. Influence of temperature on the percentage removal of diclofenac sodium and Cd2+ at pH = 7, C0=25mg L−1, adsorbent dose = 0.1 g and time = 3h.
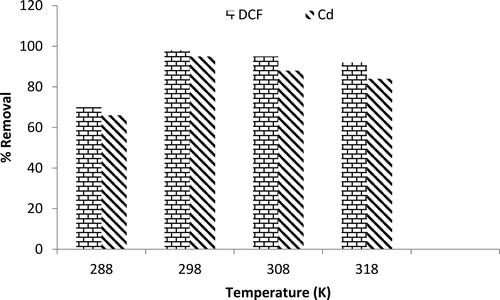
Table 2. The thermodynamic parameters determined at various concentrations.
Table 3. The filtration procedure involved the passage of 1 liter of pure water solutions containing DCF and Cd2+ at concentrations of 100, 10, 1.0 and 0.01 mg.L−1 through laboratory filters.
Table 4. Antibacterial activity of Cd2+, DCF, MgO, MgO + DCF, MgO + Cd2+, MgO + Cd2+ + DCF, levo the positive control to gram-positive bacteria and the negative control (water) in relation to the inhibition zone using the agar well diffusion method.