
Figures & data
Table 1. The subjects' background information.
Figure 1. The distribution of anti-Ro60 and anti-La/SS-B antibodies concentrations in SS and non-SS subjects. The distributions are presented using box-whisker plots (boxes: interquartile ranges; whiskers extend from the upper/lower hinges to the highest/lowest value no further than 1.5 times the ranges of the 1st and 3rd quartile points). The horizontal line in each box indicates the median. Subjects are grouped according to disease group (SS, n = 115; primary SS, n = 87; secondary SS, n = 28; non-SS, n = 34, rheumatoid arthritis, n = 62). (A) The distribution of anti-Ro60 antibody. (B) The distribution of anti-La/SS-B antibody.
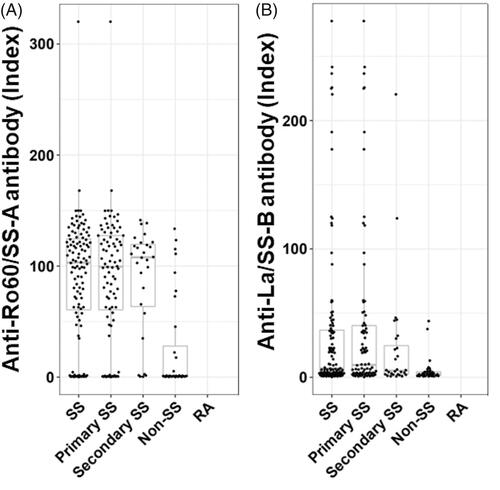
Figure 2. The relevance and distribution of anti-Ro52-seropositive SS patients. The boxes and whiskers in the respective plots represent the interquartile ranges and the ranges of 1.5 times the 1st and 3rd quartile points. Horizontal lines: the median values. (A) All subjects according to disease group (SS, n = 115; primary SS, n = 87; secondary SS, n = 28; non-SS, n = 34; RA, n = 62; and healthy subjects, n = 50). (B) SS subjects according to anti-Ro60 seropositivity. (C) SS subjects according to ACA seropositivity. (D) SS subjects with (+)/without (−) ACA seropositivity according to anti-Ro60 seropositivity. ACA: anti-centromere antibody; HC: healthy control; RA: rheumatoid arthritis.
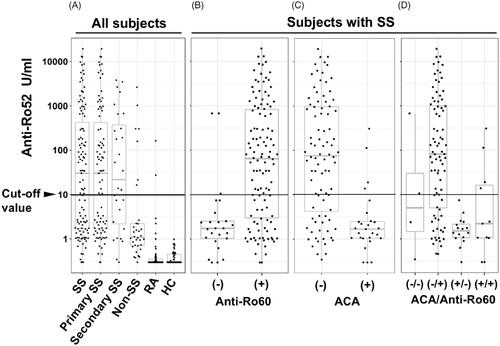
Table 2. Clinical parameters of the SS patients.
Figure 3. The difference in anti-Ro52/60 concentration by AECG criteria components and other clinical parameters. SS subjects according to the AECG criteria components and other items (RP, ACA, RF, and serum IgG). The results are presented as box-whisker plots (boxes: interquartile ranges; whiskers extend from the upper/lower hinges to the highest/lowest value no further than 1.5 times the ranges of the 1st and 3rd quartile points). Horizontal line in each box: the median. NA group: subjects who had missing data in each group. ACA: anti-centromere antibody; NA: not available; RF: rheumatoid factor; RP: Raynaud’s phenomenon.
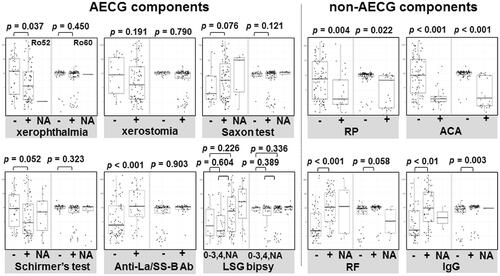
Figure 4. The relationship between the concentration of anti-Ro52/60 and the anti-La/SS-B antibody/FS. The concentration of anti-Ro52 (A, C) or anti-Ro60 (B, D) is plotted on the x-axis as the measured concentration of anti-La/SS-B antibody (A, B) or the focus score (FS) (C, D). The distribution of the titers of the subjects with missing x-axis values is shown as a box-whisker plot beside each scatterplot.
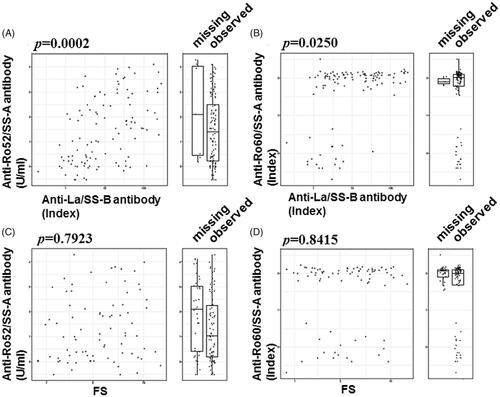
Figure 5. The clinical parameters relevant to the transition of the anti-Ro52 concentration. The ROC curves of the levels of anti-Ro52 and anti-Ro60 for each clinical parameter are shown. The clinical parameters were 10 AECG components and 5 other factors. The p-value in each panel is the result of a test of the null hypothesis that the AUC of the anti-Ro52 ROC curve was 0.5. Ab: antibody; ACA: anti-centromere antibody; ESSDAI: EULAR Sjögren's Syndrome Disease Activity Index; FS: focus score; LSGB: labial salivary gland biopsy; RF: rheumatoid factor; RP: Raynaud’s phenomenon.
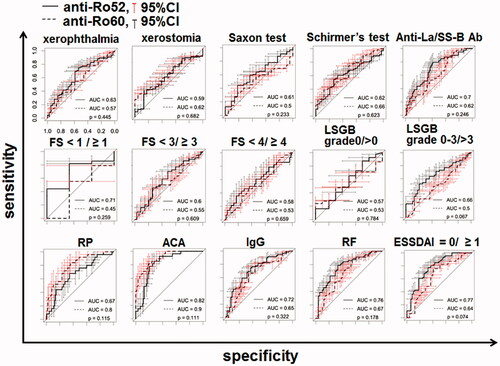
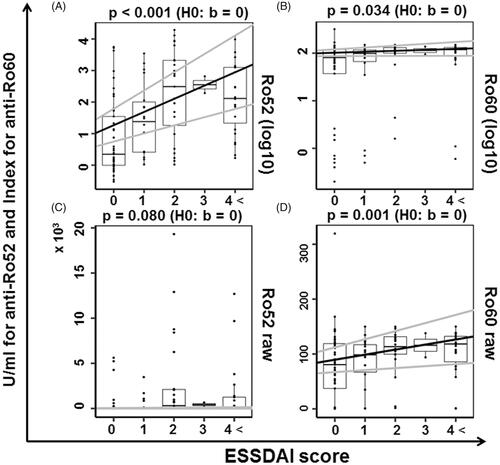
Figure 6. The relevance of anti-Ro52/60 antibodies according to the ESSDAI score. The lines with the intercept and slope were obtained from the linear regression (gray line: 95%CI) and box-whisker plots (boxes: interquartile ranges; whiskers extend from the upper/lower hinges to the highest/lowest value no further than 1.5 times the ranges of the 1st and 3rd quartile points). The y-axis data were scaled on a logarithmic scale with base 10 in panels A and B and not scaled in (C) and (D). ESSDAI: EULAR Sjögren's Syndrome Disease Activity Index.
Supplemental Material
Download TIFF Image (2.5 MB)Supplemental Material
Download TIFF Image (913.9 KB)Supplemental Material
Download TIFF Image (10 MB)Data availability statement
The datasets used and/or analyzed in this study are available from the corresponding author on reasonable request.