Figures & data
Figure 1. Dependence of sample temperature on applied voltage during the CPE process.
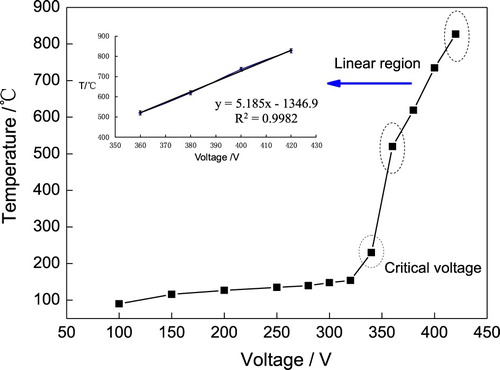
Figure 2. (a) Cross-sectional image of the CPE treated steel at 340 V, (b) average grain sizes of three typical regions, I: steel matrix, II: transition region, III: surface region.
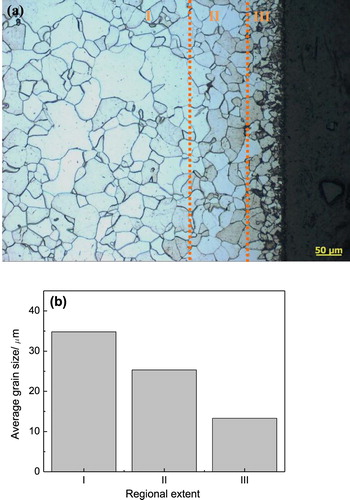
Figure 3. Cross-sectional morphologies of the CPE treated steel at 360 V for 1 min (a), 380 V for 1 min (b), and 380 V for 3 min (c).
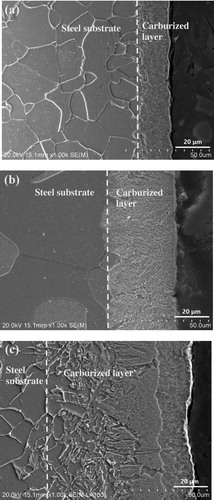
Figure 4. XRD patterns of the steel substrate and the CPE treated steels at 360 V for 1 min, 380 V for 1 min, and 380 V for 3 min.
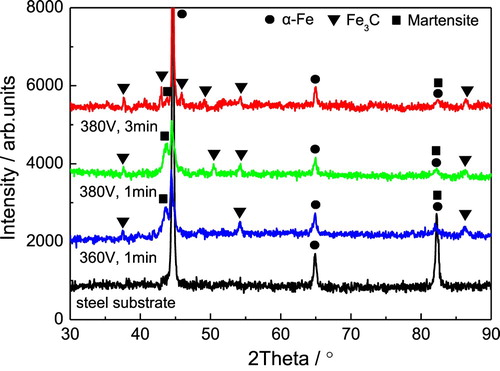
Table 1. Diffusion coefficient comparison of PEC and traditional pack carburizing at the same temperature.
Figure 5. Cross-sectional morphology (a) and XRD analysis (b) of the CPE treated steel at 400 V for 5 min.
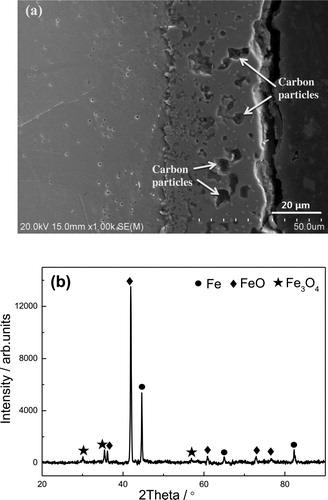
Figure 6. (a) Typical emission spectrum of carburizing process at 380 V and (b) typical emission spectrum of oxidation process at 400 V.
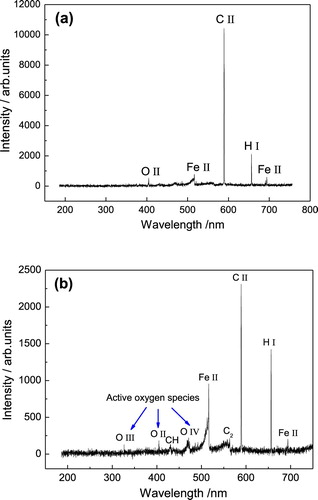
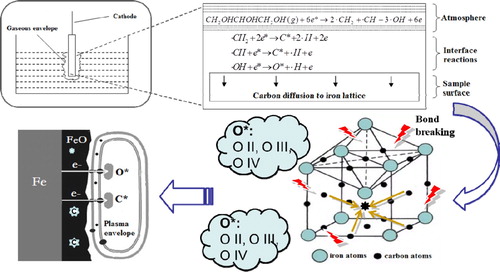
Figure 7. Interfacial reactions and carbon evolution process during CPE on steel.