
Figures & data
Figure 1. A simplified diagram of potentially toxic element (PTE) detoxification by extracellular and intracellular ligands. Both passive and active entrance of PTEs into the cell are illustrated, as well as the potential EPS-PTE interactions that may occur during passive sorption. Active transport of PTEs into the cell have been illustrated with a generic transporter, though these may bePTE-specific. + symbols indicate the addition of an actor and not the relative charge. GSH = reduced glutathione,γ-glutamate-cysteine-glycine; GSH-PTE = PTE-loaded GSH; GST = glutathione S-transferase; PCS = phytochelatin synthetase; PC-PTE = PTE-loaded phytochelatin; EPS = Extracellular Polymeric Substances; ROS = reactive oxygen species; GSSG = oxidized glutathione.
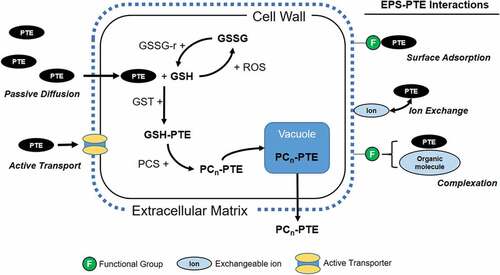
Figure 2. The chemical structure of glutathione (GSH) and the dimeric form of phytochelatin (PC). Amino acid constituents are colour-coded in both molecules.
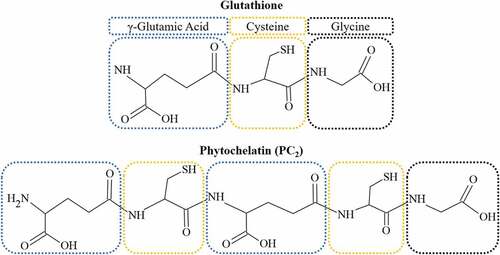
Table 1. Summary of phytochelatin (PC) response by multiple algae species following potentially toxic element (PTE) exposure. System conditions including present PTEs, PTE concentration, and exposure time are reported with units standardized where possible. PC content as well as the direction of PC change and the significance of this change are reported. PC content below the detection limit is reported as BD. When PCs are not detected, ND is reported in the PC content column. The Direction of PC change is determined from the difference between 0.0 mg PTE l−1 control and the experimental treatment. Direction of change may illustrate an increase (![]() ), decrease (
), decrease (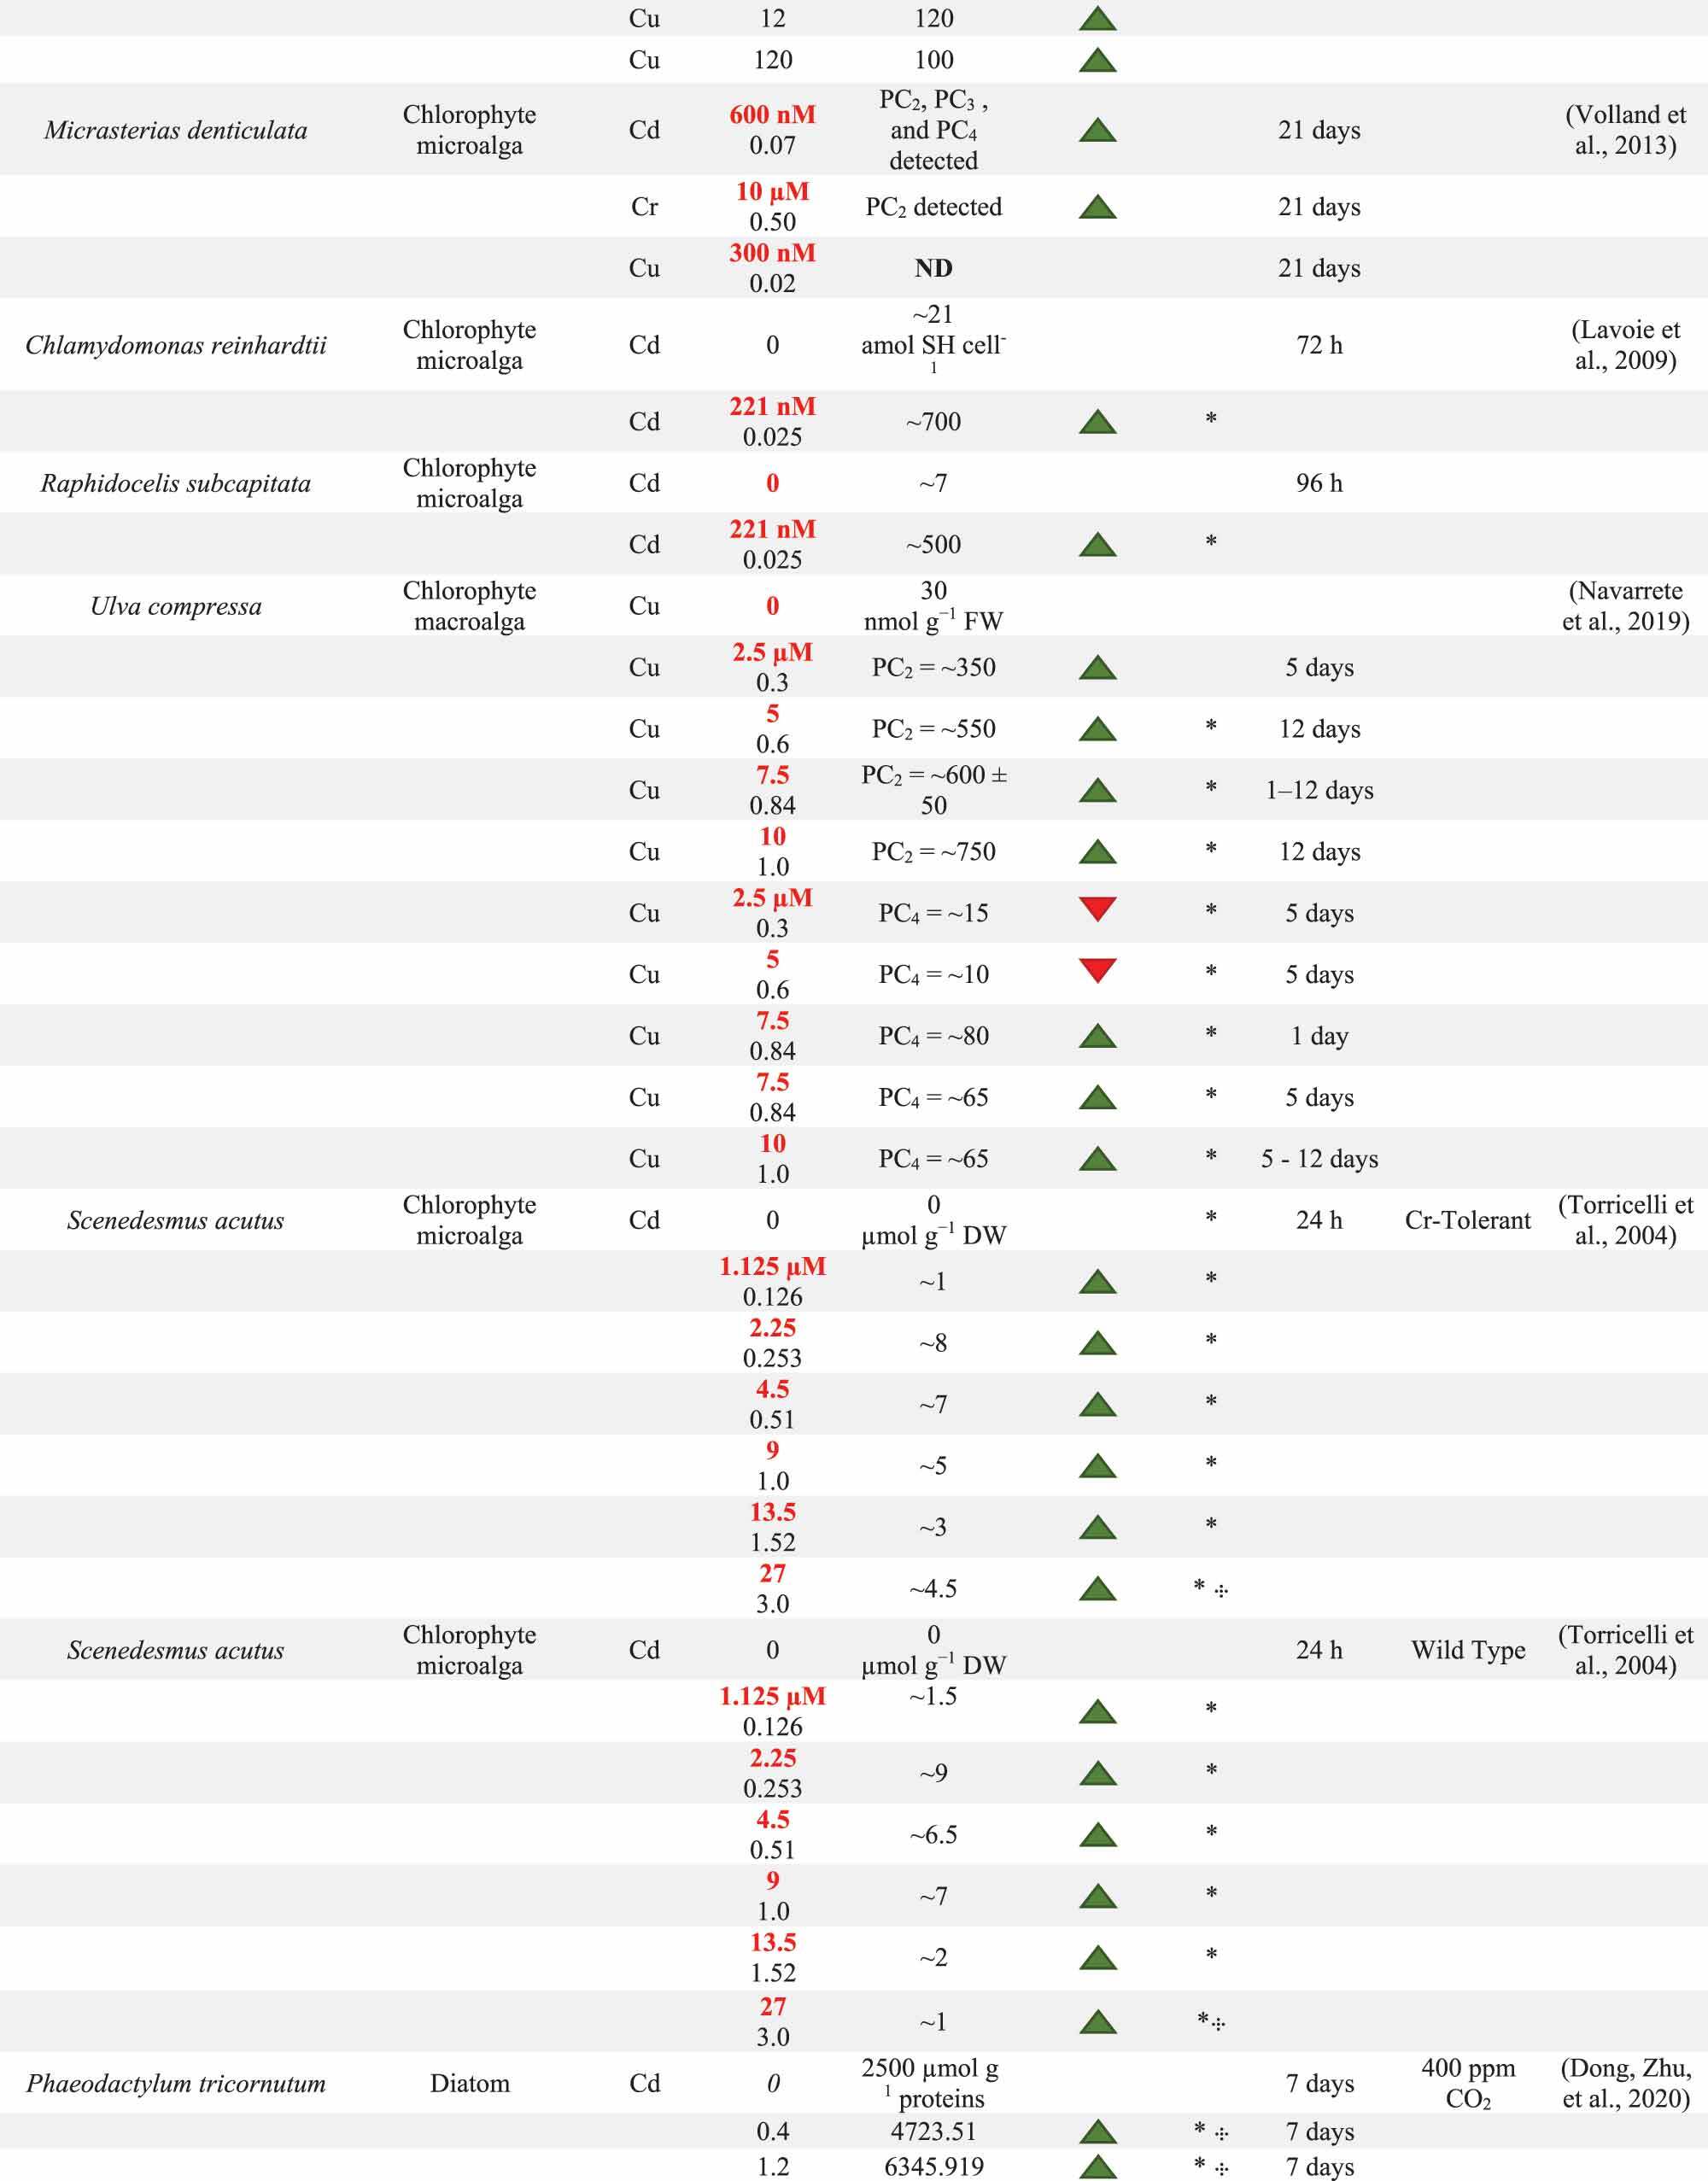 ), or lack of change (
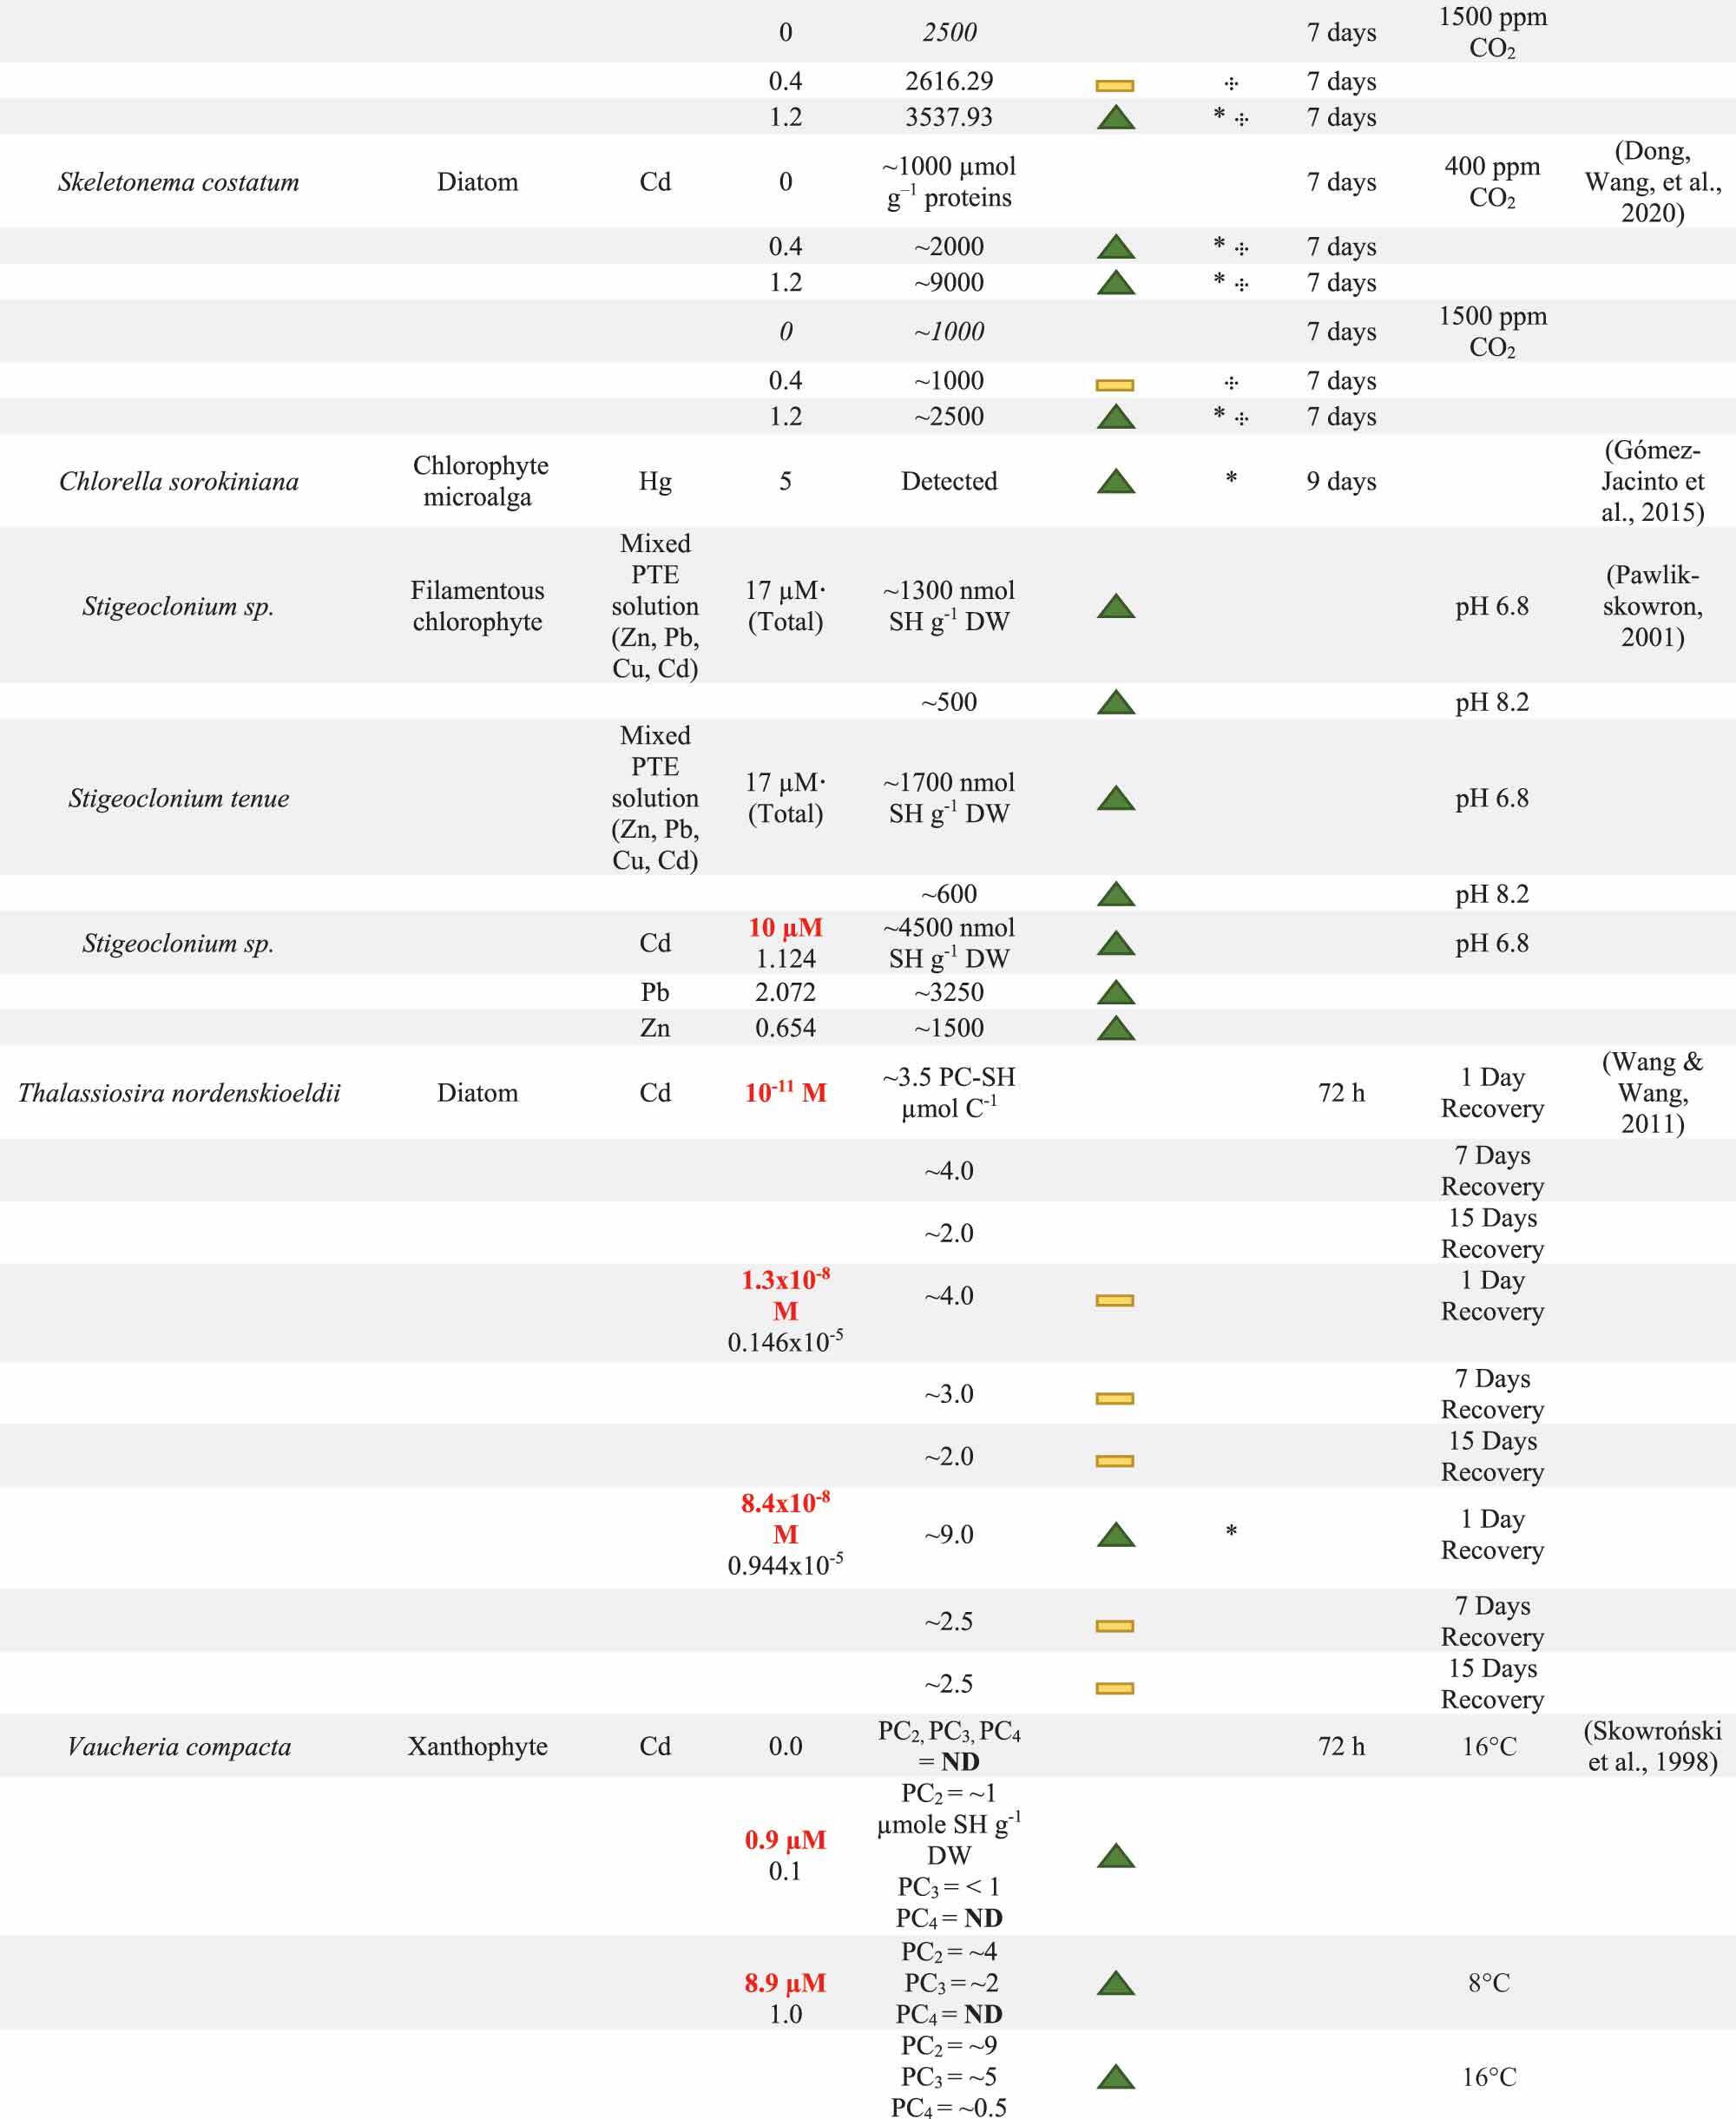 ) in PC content. Significant difference between control and experimental cultures is marked with *. Significant difference between the PC content of two experimental treatments exposed to the same PTE concentration, but with different physico-chemical conditions is marked with
 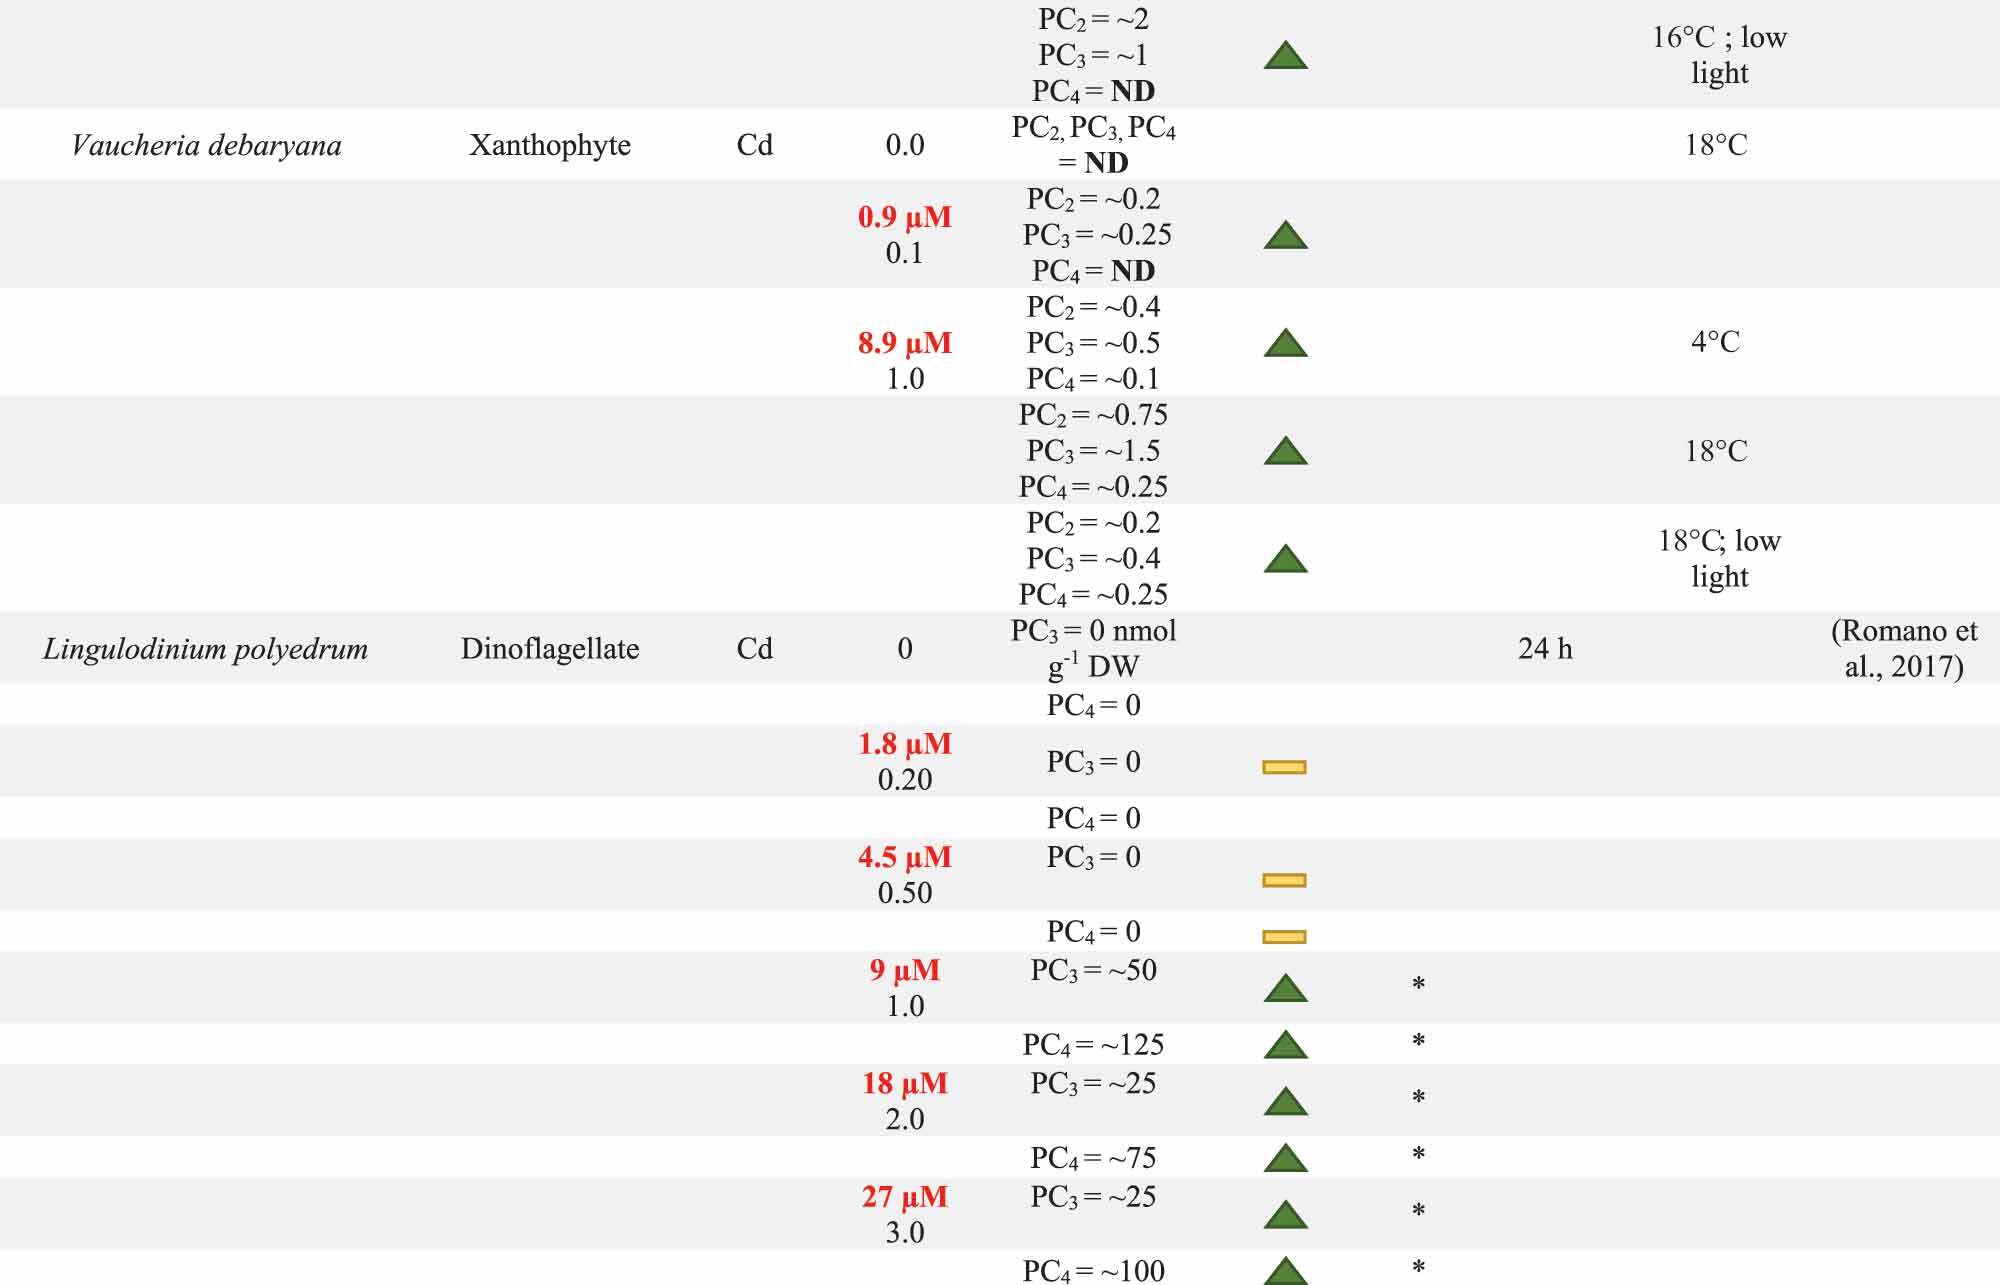 . The units for PC content are reported in the first entry for each evaluation. PTE concentrations have been converted to mg l−1 where necessary with original concentrations have been reported in red. Units that could not be converted are marked with ·. Additional notes on biomass qualities or physico-chemical conditions are included in the Notes column.