
Figures & data
Table 1. Physico-chemical condition of the seawater used for the preparation WSF of the fuels and culture medium.
Figure 1. Physiological response (growth) of test algae to the WSF of the different petroleum fuels with time: a) growth response of Nannochloropsis oculata in kerosene, b) growth response of N. oculata in diesel, c) growth response of N. oculata in gasoline.
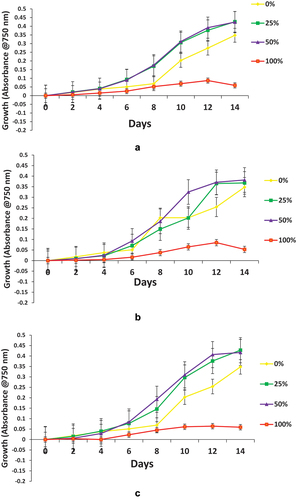
Figure 2. Physiological response (growth) of test algae to the WSF of the different petroleum fuels with time: a) Growth response of Porphyridium cruentum in kerosene, b) growth response of P. cruentum in diesel, c) growth response of P. cruentum in gasoline.
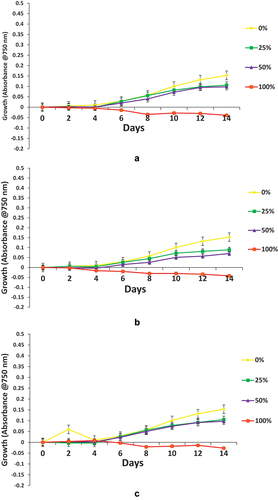
Figure 3. Morphological alteration of Nannochloropsis oculata in kerosene at the end of the experiment; a) N. oculata before experiment, b) 0% WSF, c) 25% WSF, d) 50% WSF and e) 100% WSF of kerosene, respectively. Magnification × 100, arrows highlight algal cells.
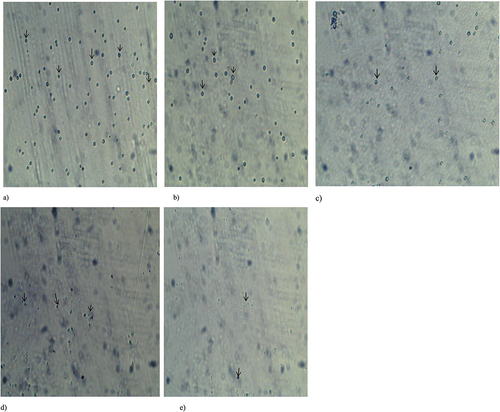
Figure 4. Morphological alteration of Nannochloropsis oculata in diesel at the end of the experiment; a) N. oculata before experiment, b) 0% WSF, c) 25% WSF, d) 50% WSF and e) 100% WSF of kerosene, respectively. Magnification × 100, arrows highlight algal cells.
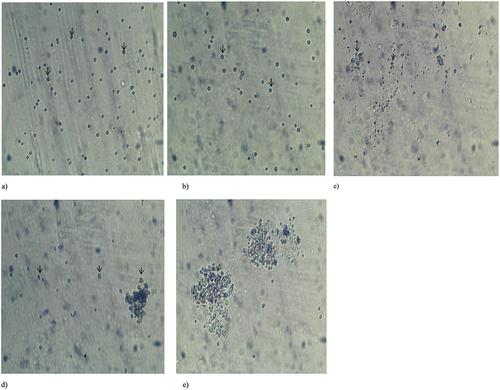
Figure 5. Morphological alteration of Nannochloropsis oculata in kerosene at the end of the experiment; a) N. oculata before experiment, b) 0% WSF, c) 25% WSF, d) 50% WSF and e) 100% WSF of kerosene, respectively. Magnification x 100, arrows highlight algal cells.
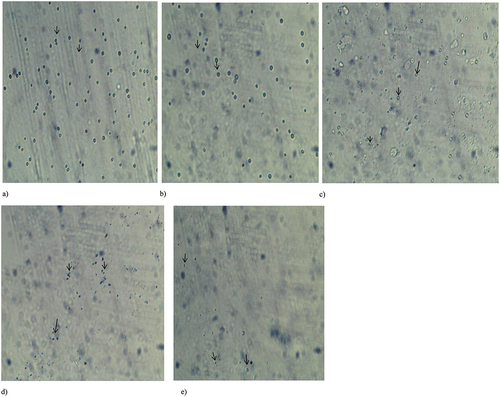
Figure 6. Morphological alteration of Porphyridium cruentum in kerosene at the end of the experiment; a) P. cruentum before experiment, b) 0% WSF, c) 25% WSF, d) 50% WSF and e) 100% WSF of kerosene, respectively. Magnification x 100, arrows highlight algal cells.
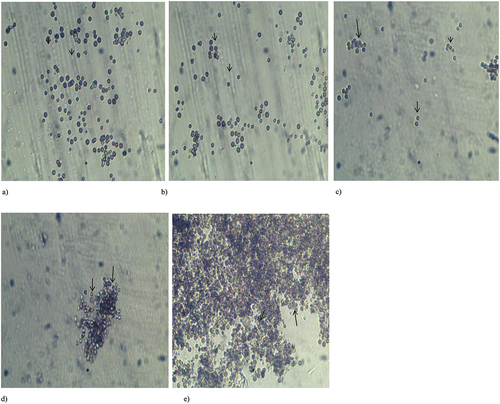
Figure 7. Morphological alteration of Porphyridium cruentum in diesel at the end of the experiment; a) P. cruentum before experiment, b) 0% WSF, c) 25% WSF, d) 50% WSF and e) 100% WSF of kerosene, respectively. Magnification x 100, arrows highlight algal cells.
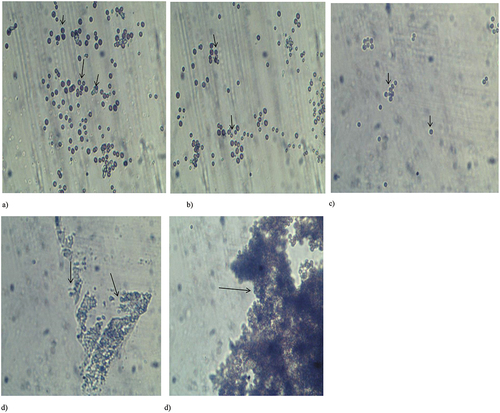
Figure 8. Morphological alteration of Porphyridium cruentum in gasoline at the end of the experiment; a) P. cruentum before experiment, b) 0% WSF, c) 25% WSF, d) 50% WSF and e) 100% WSF of kerosene, respectively. Magnification x 100, arrows highlight algal cells.
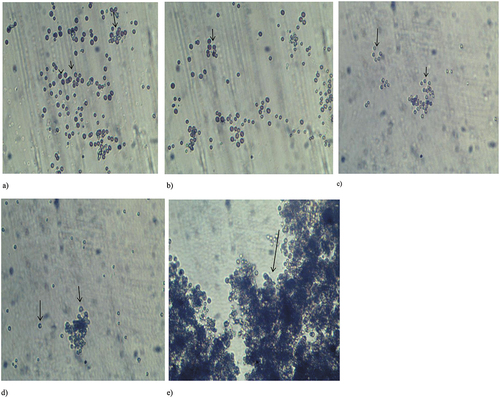
Table 2. Cell size range and shape of Nannochloropsis oculata at the end of experiment (day 14).
Table 3. Cell size range of Porphyridium cruentum at the end of experiment (day 14).
Figure 9. a) Peroxidase concentrations of Nannochloropsis oculata in the different petroleum fuels at the end of the experiment (day 14), b) peroxidase concentration of Porphyridium cruentum in the different petroleum fuels at the end of the experiment (day 14).
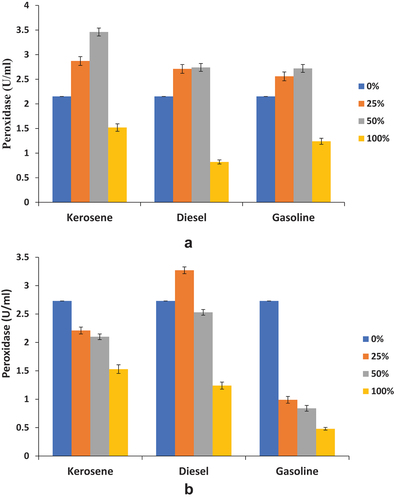
Figure 10. a) Superoxide dismutase concentration in Nannochloropsis oculata in the different petroleum fuels at the end of the experiment (day 14), b) Superoxide dismutase concentration of Porphyridium cruentum in the different petroleum fuels at the end of the experiment (day 14).
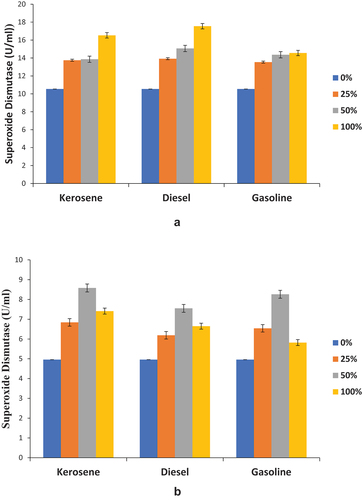
Figure 11. a) Catalase concentration of Nannochloropsis oculata in the different petroleum fuels at the end of the experiment (day 14), b) catalase concentration of Porphyridium cruentum in the different petroleum fuels at the end of the experiment (day 14).
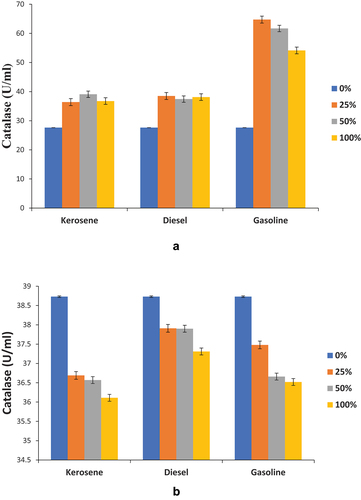
Figure 12. a) Chlorophyll a concentration of Nannochloropsis oculata in the different petroleum fuels at the end of the experiment (day 14), b) chlorophyll a concentration of Porphyridium cruentum in the different petroleum fuels at the end of the experiment (day 14).
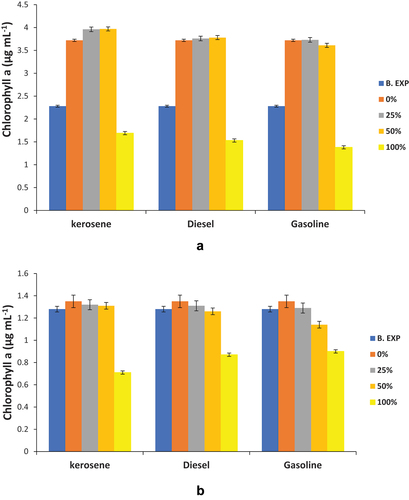
Figure 13. a) Principal component analysis biplot showing the relationship between growth, chlorophyll a (Chl a), peroxidase (POD), superoxide dismutase (SOD) and catalase (CAT) activity of Nannochloropsis oculata in kerosene, b) principal component analysis biplot showing the relationship between growth, chlorophyll a (Chl a), peroxidase (POD), superoxide dismutase (SOD) and catalase (CAT) activity of Nannochloropsis oculata in diesel, c) Principal component analysis biplot showing the relationship between growth, chlorophyll a (Chl a), peroxidase (POD), superoxide dismutase (SOD) and catalase (CAT) activity of Nannochloropsis oculata in gasoline.
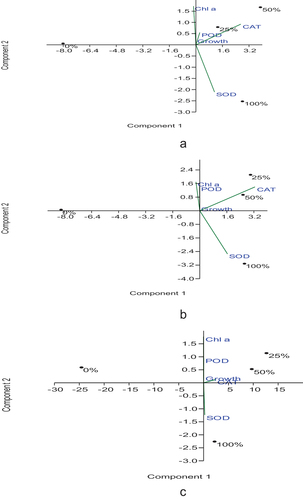
Figure 14. a) Principal component analysis biplot showing the relationship between growth, chlorophyll a (Chl a), peroxidase (POD), superoxide dismutase (SOD) and catalase (CAT) activity of Porphyridium cruentum in kerosene, b) principal component analysis biplot showing the relationship between growth, chlorophyll a (Chl a), peroxidase (POD), superoxide dismutase (SOD) and catalase (CAT) activity of Porphyridium cruentum in diesel, c) principal component analysis biplot showing the relationship between growth, chlorophyll a (Chl a), peroxidase (POD), superoxide dismutase (SOD) and catalase (CAT) activity of Porphyridium cruentum in gasoline.
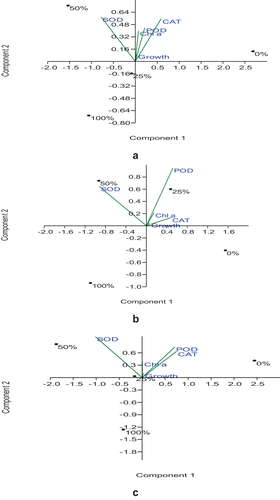
Table 4. Petroleum hydrocarbon component of the WSF of the different petroleum fuels.