
Figures & data
Figure 1. Map of the Barranquilla Metropolitan Area (BMA) showing its main ecosystems.
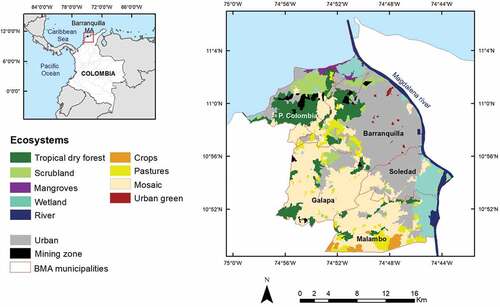
Figure 2. Proposed SEM model indicating the contributions of Ecosystem services (ES), Ecosystem disservices (EdS) and Relational values (RV) to Human well-being (HWB) and the relations between latent and manifest variables. Note that ovals represent latent variables (i.e. unobserved constructs), while the rectangles represent manifest variables collected in the survey.
Figure 3. Perception of positive contributions of different ecosystems to human well-being (HWB) identified by the BMA population. TDF: tropical dry forest.
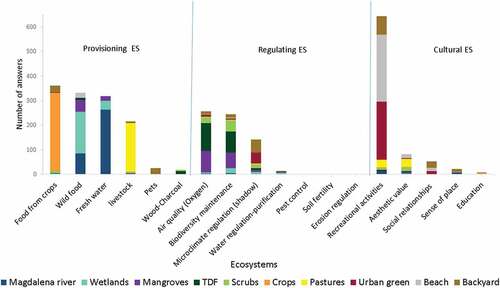
Figure 4. Ecosystems contribution to human well-being (HWB) in BMA: positive contributions (grouped in provisioning, regulating and cultural services) and negative contributions (disservices). TDF: tropical dry forest.
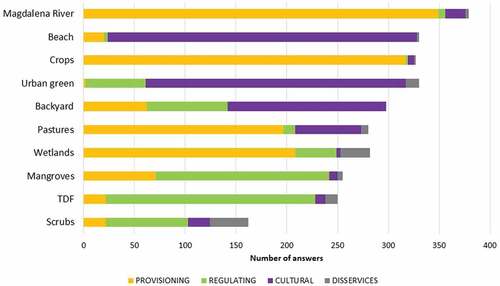
Figure 5. Negative contribution of ecosystems to human well-being (HWB) identified by the BMA population. TDF: tropical dry forest.
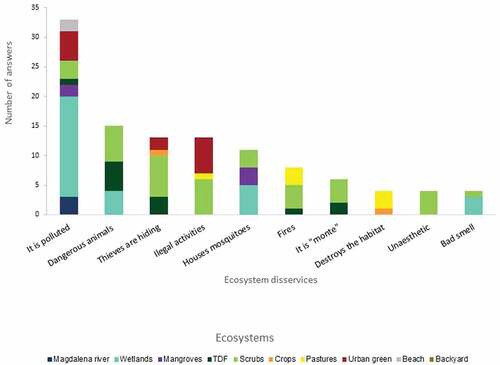
Figure 6. Scatter plot representing the perceived importance (X-axis) and vulnerability (Y-axis) of the ecosystem services and disservices in BMA.
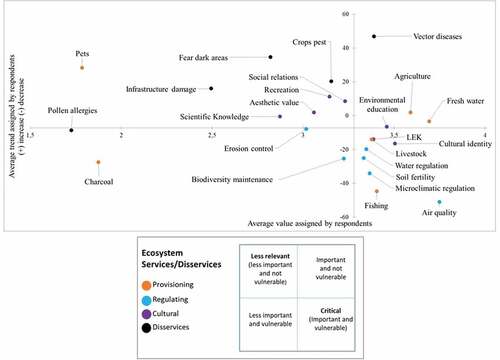
Table 1. Structural Equation Model estimates, standard errors (S.E.), z-values, p-values, standardized coefficients, R2, and model goodness-of-fit indicators CFI (Comparative fit index) and TLI (Tucker Lewis Index).
Figure 7. (a) Contribution of Ecosystem services (ES), Ecosystem disservices (EdS) and Relational values (RV) to Human well-being (HWB) and standardized factor loadings of the second-order latent variable (ES). (b) Contribution of Ecosystem services (ES), Ecosystem disservices (EdS) and Relational values (RV) and Socio-economic factors (income and education) to Human well-being (HWB). CMW: current minimum wage. 0.01<*p values ≤0.05; 0.001<**p values≤0.01; ***p values ≤0.001.
Table 2. SEM-MIMIC results.