Figures & data
Figure 1. Study area map, showing the location of different communities included in the study of the valdivian coast. Each community is represented by a different color. The red line indicates the crossing of the ship between Niebla and Corral (Corral is a town, commune in Valdivia Province). The black dot represents the main city in the region, Valdivia.
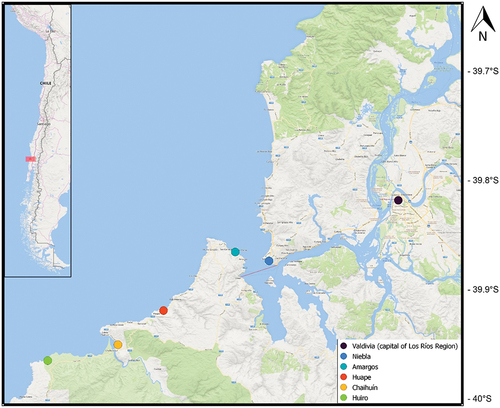
Table 1. Top five of saliency index for species and values on terrestrial and marine ecosystems. Values close to 1 are the most salient item, always named first.
Figure 2. Sankey diagram representing connections between group of species, represented as class of species (left panel), communities (middle panel) and values (right panel). The width of each bar represents the frequency of data.
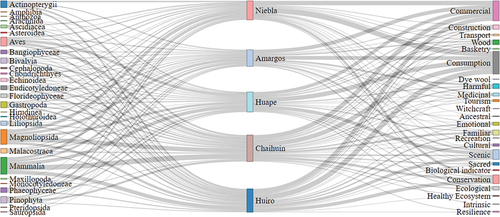
Figure 3. Radar plot showing the relation between the different group of values: relational, intrinsic, and instrumental for a) land and sea species and for b) exotic and native species. Each group has a value between 0 and 1.
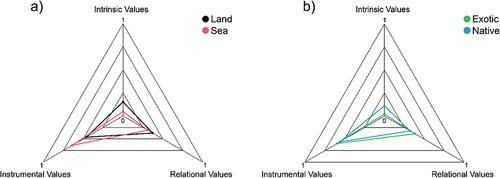
Table 2. Concepts of relational values approach defined by Chan et al. (Citation2016) and land and marine based examples from the fieldwork.
Figure 4. Comparison of livelihoods of different communities. Colors represent a different activity. Boxplots show the mean (grey dot), median, hinges, whiskers, and outliers (black dot). Formal, informal and tourism jobs are a binary response between 0 and 1.
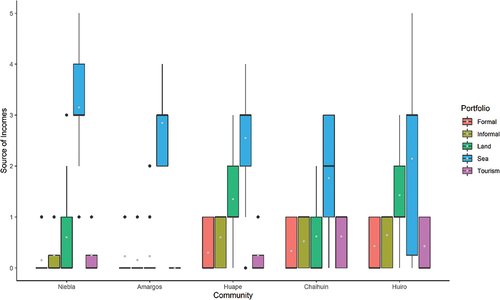
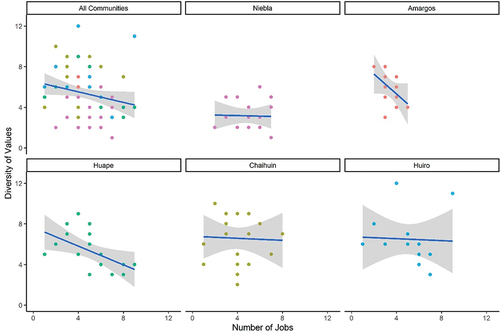
Figure 5. Relation between livelihoods (as number of different jobs) and diversity of values at individual-level. Blue slope shows the correlation. Each point was colored according to the community that each inhabitant belonged to.