Figures & data
Figure 1. Flowchart of events included in contraceptive calendar
Note: 12,209 episodes are from 3950 women, and the analytical sample of 2623 episodes are from 1966 women in Arusha region, Tanzania
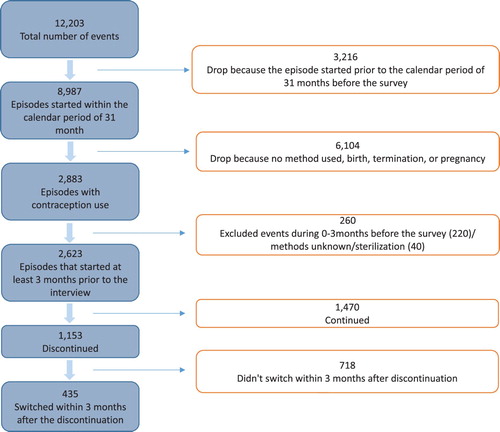
Table 1. Distribution of women, by background characteristics, Arusha, 2018
Table 2. Number and per cent of contraceptive episodes and median duration of use, by type of method, Arusha, 2018
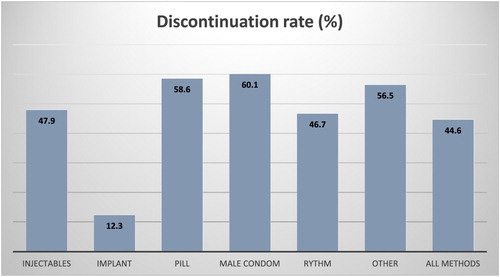
Figure 2. Per cent discontinuing use by 12th month, by type of contraceptive method, Arusha, 2018
Notes: The sample is 2623 episodes which were initiated after the baseline interview among 1966 women. “Other” methods include IUD and withdrawal due to the small size, in addition to Lactational amenorrhoea