Figures & data
Table 1. Demographics and parenting intentions and experiences from an online survey of women aged 18–60 years
Table 2. Support for access to egg freezing for medical reasons by participant’s demographic characteristics and parenting intentions and experiences
Figure 1. The relationship between non-medical egg freezing (EF) and participant demographics. Symbols represent the adjusted Odds Ratio (OR) and the bars indicate the 95% confidence intervals. The OR were adjusted for age, highest level of education, relationship status and socioeconomic status
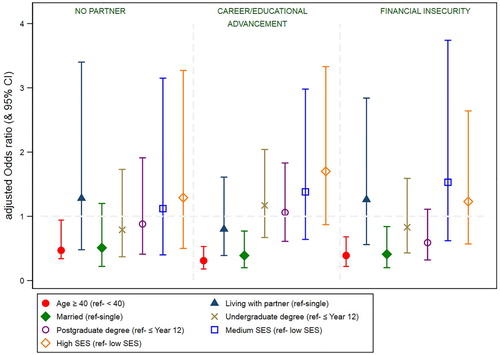
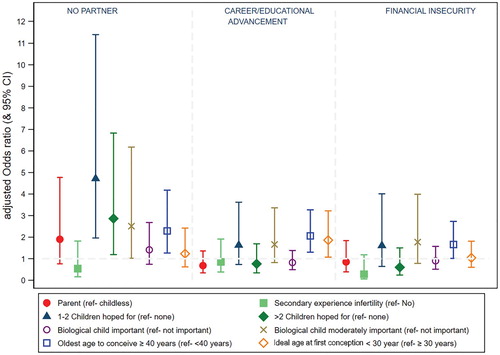
Figure 2. The relationship between non-medical egg freezing (EF) and participant parenting intentions and experiences. Symbols represent the adjusted Odds Ratio (OR) and the bars indicate the 95% confidence intervals. The ORs for the relationship between parenting intentions and experiences, and attitudes were adjusted for age, highest level of education and relationship status