Figures & data
Table 1. Description of important concepts
Table 2. Profiles of study hospitals
Table 3. Description of the RMC intervention
Table 4. Summary of participants and topic areas investigated during FGDs and IDIs
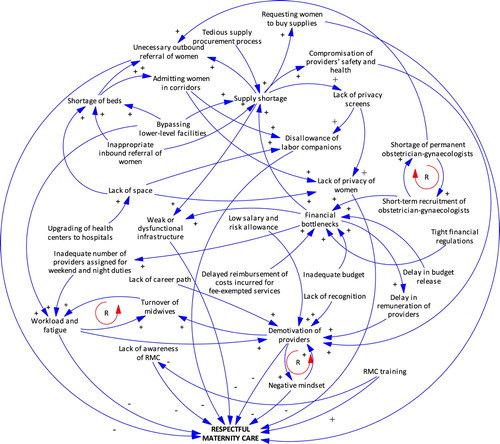
Figure 1. Causal loop diagram of factors influencing respectful maternity care in hospitals*
Notes: “+” sign on the blue arrows indicates the causing variable increases the outcome variable. “−” sign on the blue arrows indicates the causing variable reduces the outcome variable. “R” in the red rotating arrows indicates the variables have a reinforcing effect on each other in the direction of the arrow.