
Figures & data
Figure 1. Stages of IDIs
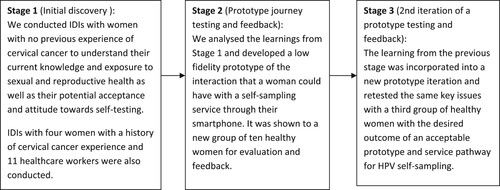
Table 1. Demographic and socioeconomic characteristics of healthy women participants
Figure 2. Proposed user journey presented to the participants in stage 2 and 3*
*Between stage 2 and 3, the format of information provided in the prototypes was adapted following potential user feedback
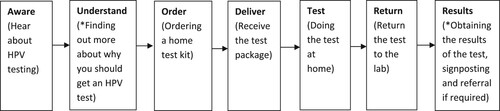
Table 2. Findings on the proposed user journey as per the healthy participants’ feedback
Table 3. Quotes from the healthy participants