
Figures & data
Figure 1. ARCHES cluster-controlled trial consort flow chart (Nairobi, Kenya; 2019)
Notes: *Participants were contacted at the 6-month follow-up point irrespective of their participation in the 3-month follow-up, unless they had specifically declined further study participation. **Numbers at exit reflect those included in the analytical sample via the modified ITT approach
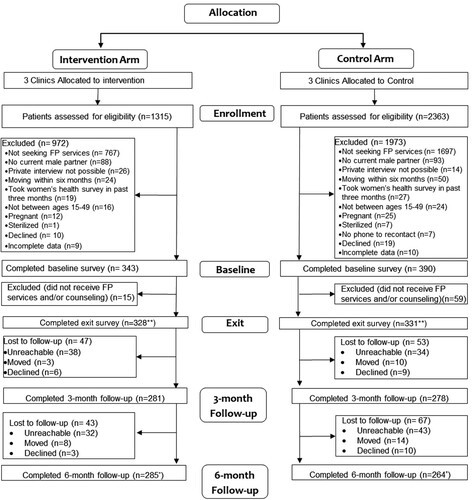
Table 1. Female family planning client characteristics at baseline by ARCHES modified intent-to-treat (mITT) treatment groups, unweighted (unbalanced) and IPTW (balanced) (Nairobi, Kenya; 2019)
Figure 2. IPTW descriptive outcomes [proportions (binary) and means (continuous)] graphed over time within mITT treatment groups (Nairobi, Kenya; 2019)
aReporting using inverse probability of treatment weights (IPTW - weighted on treatment against baseline characteristics) using ATT (average effect among the treated. Baseline characteristics used for weighting include age (continuous), marital status, education level, parity, food insecurity, language of survey administration, employment for paid work in the past year, and current modern contraceptive use. bBinary outcome, reported in IPTW proportions cScale resized to improve readability dContinuous outcome, reported in IPTW means Symbols are utilized to denote where the beta (i.e. average change in slope) between intervention and control at three- and/or six-month follow-up is statistically significant (see Table 3): ^p<.1, * p<.05
![Figure 2. IPTW descriptive outcomes [proportions (binary) and means (continuous)] graphed over time within mITT treatment groups (Nairobi, Kenya; 2019)aReporting using inverse probability of treatment weights (IPTW - weighted on treatment against baseline characteristics) using ATT (average effect among the treated. Baseline characteristics used for weighting include age (continuous), marital status, education level, parity, food insecurity, language of survey administration, employment for paid work in the past year, and current modern contraceptive use. bBinary outcome, reported in IPTW proportions cScale resized to improve readability dContinuous outcome, reported in IPTW means Symbols are utilized to denote where the beta (i.e. average change in slope) between intervention and control at three- and/or six-month follow-up is statistically significant (see Table 3): ^p<.1, * p<.05](/cms/asset/d019b708-245e-4c3f-bd53-1b5f4f9b4cae/zrhm_a_2227371_f0002_oc.jpg)
Table 2. IPTW descriptive outcomes at each time point within mITT treatment groups (Nairobi, Kenya; 2019)
Table 3. Difference-in-differences average treatment effect among the treated (time × treatment) comparing treatment groups (ref = control) from multi-variable mixed-effect regression (Nairobi, Kenya; 2019)
ARCHES proximal supplements 1-4
Download MS Word (44.6 KB)Data availability
Statistical code and the de-identified analysis dataset is available from the Dryad repository, DOI https://doi.org/10.6076/D1Q30G.