
Figures & data
Figure 1. Mzantsi Wakho cohort study flow chart. Abbreviations: T1, wave 1; T2, wave 2; T3, wave 3
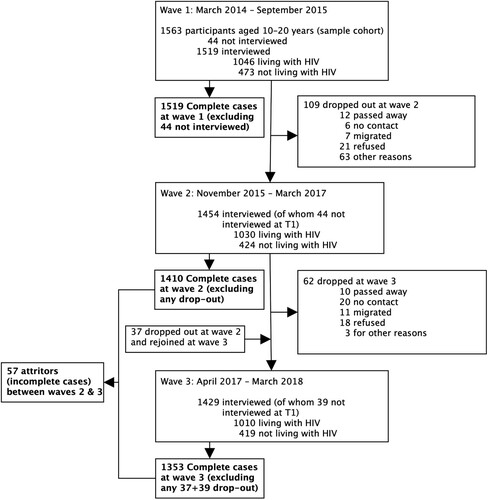
Table 1. Descriptive characteristics of the study population
Figure 2. Sexual risk behaviours by participant's sex across waves. Abbreviations: Cl, confidence interval
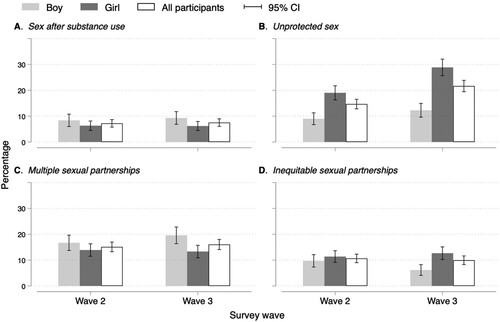
Figure 3. Sexual risk behaviours by participant's HIV status across waves. Abbreviations: Cl, confidence interval. HIV, human immunodeficiency virus . HIV-, adolescents not living with HIV. HIV+, adolescents living with HIV
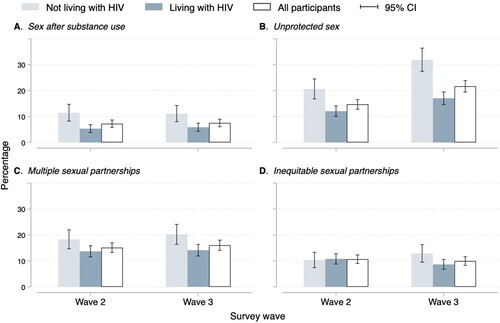
Table 2. Multivariable association between mobile phone access and use and self-reported sexual risk behaviours. Results from mixed-effects logistic regression models on ten imputed datasets (n = 1353)
Table 3. Comparisons of the multivariable association between mobile phone access and use and self-reported sexual risk behaviours for boys, girls, adolescents living with and without HIV. Results from mixed-effects logistic regression models on ten imputed datasets (n = 1353 including 587 boys, 766 girls, 933 living with HIV, and 420 not living with HIV)
Appendix 1: STROBE Statement—Checklist of items that should be included in reports of cohort studies
Appendix 2: Comparison between participants interviewed in both waves (2 and 3) and those who dropped out of the study (between wave 2 and 3)
Appendix 3: Missing data imputations
Appendix 4: Spearman’s bivariate correlation coefficients (95% CI; p-value) between outcome variables. Below the diagonal (value 1) are between-participants correlations and above the diagonal are within-participants correlations
Appendix 5: Summary of statistical models
Appendix 6a: Sensitivity analyses. Multivariable association between mobile phone access and use and self-reported sexual risk behaviours. Results from mixed-effects logistic regression models on complete cases
Appendix 6b: Sensitivity analyses. Comparisons of the multivariable association between mobile phone access and use and self-reported sexual risk behaviours for boys, girls, adolescents living with and without HIV. Results from mixed-effects logistic regression models on complete cases
Supplemental Material: Appendices 1-6
Download MS Word (68.8 KB)Data sharing and data availability statement
Prospective users, policymakers/government agencies/researchers (internal/external) will be required to contact the study team to discuss and plan the use of data. Research data will be available on request subject to participant consent and having completed all necessary documentation. All data requests should be sent to the Elona Toska ([email protected]) or William Rudgard ([email protected]).