Figures & data
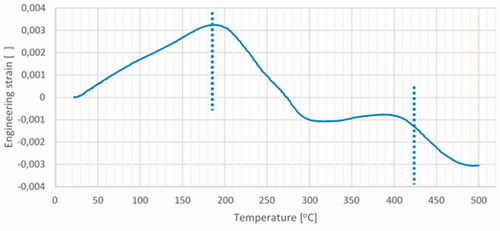
Figure 1. Illustrative drawing of specimens which were 3D printed in vertical and horizontal orientation and their flexural strength testing set up. (a) Specimen printed in vertical orientation, (b) Specimen printed in horizontal orientation, (c) vertically printed specimen in flexural strength test, (d) horizontally printed specimen in flexural strength test.
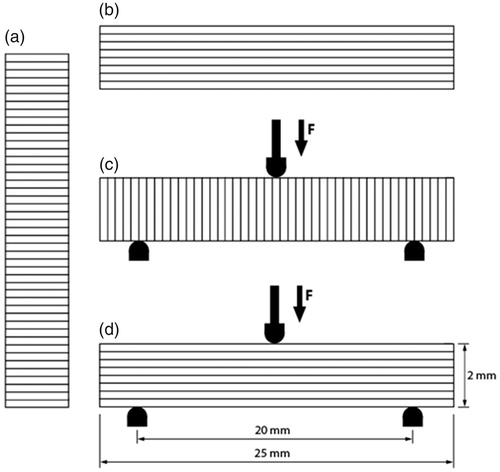
Table 1. The most substantial printing parameters of the groups Z-1, Z-2, Z-3 and Z-4.
Figure 2. The 3-point flexural strength values of the groups Z-1, Z-2, Z-3, Z-4 and control 1 group. Different superscript letters (a, b, c, d, e) indicate statistical difference (ANOVA, Tukey HSD, p < .05).
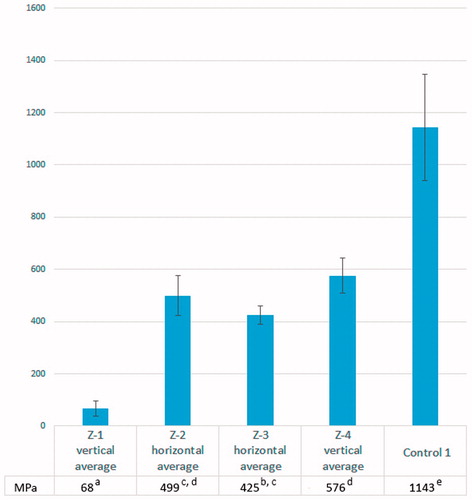
Figure 3. SEM micrograph of layer structure. Layer thickness varies from under 13 µm to over 20 µm. The specimen in the picture is from group Z-2. Magnification 300×.
Figure 4. SEM micrograph revealed pores in specimens of group Z-3. Magnification 1000×.
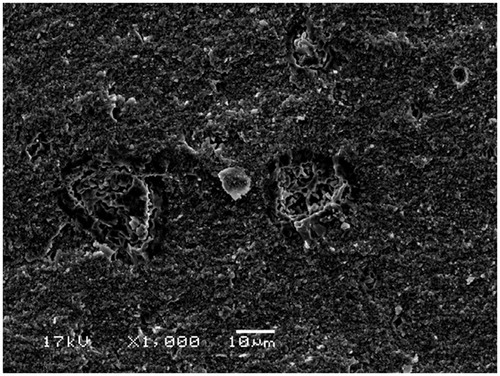
Figure 5. The FESEM micrograph of the specimen which was thermally treated in 1500 °C reveals that the grain size is 392 nm (standard deviation 154 nm).
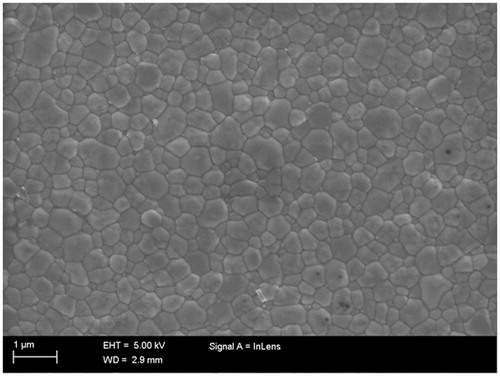
Figure 6. Optical microscope images of fractured ZrO2 surfaces. (a) low strength (108 MPa) specimen with delamination covering more than half of the cross-sectional area true fractured surface area marked with dashed red line) (b) high strength (665 MPa) sample with a characteristic mirror area on the right bottom corner with blue arrows indicating the direction of crack propagation. The compression surface is facing upwards and tensile surface downwards.
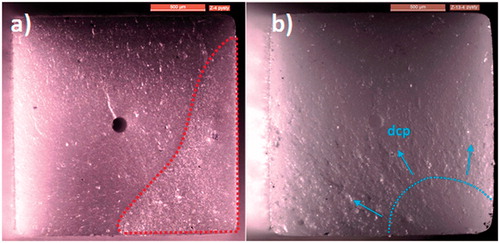
Figure 7. Optical microscope images of fractured ZrO2 surfaces exhibiting lowest measured strength. (a) low strength (57 MPa) specimen with delamination covering roughly half of cross-sectional area true fractured surface area marked with dashed red line) and (b) low strength sample (35 MPa) with one of the lowest measured strength. The compression surface is facing upwards and tensile surface downwards.
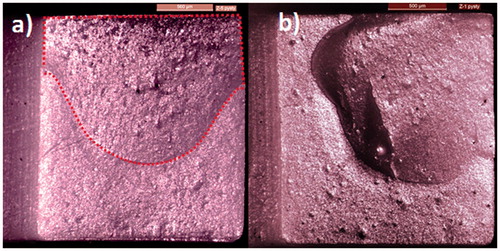
Figure 8. Dilatometry measurements of an as-printed ZrO2 sample up to 150 °C. The first cycle (blue) indicates shrinkage of the sample by 1.0–1.5%. The second cycle (red) on the same sample shows a linear thermal expansion of the sample. Shrinkage in the first cycle is most likely due to polymerization reaction which is exhausted during the first heating cycle. Heating and cooling rate was 0.2 C°/min.
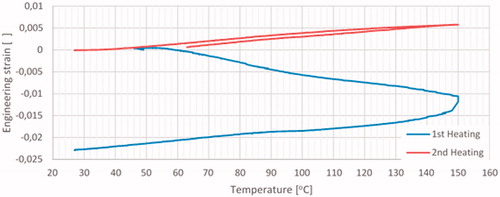
Figure 9. Dilatometry measurement of printed ZrO2 sample heat cycled to 150 °C prior to the test. Thermal expansion is accompanied by two linear shrinkage sequences starting at 170 °C and 390 °C (dashed lines). Heating rate was 0.5 C°/min.