
Figures & data
Table 1. Materials used in the investigation.
Figure 1. Various sized composite blocks, test specimens named a, b, c, and d with thermocouples placed in the centre or half-way from surface to centre.
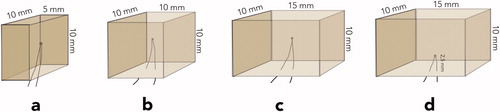
Figure 2. Test specimen assemblies named e, f, and g, with thermocouples placed in the centre radius between tooth and composite.
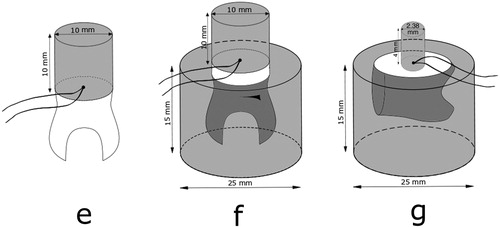
Figure 3. Overview of composite block cut in the x and y directions, with rod ends color-coded for identification of position and used for micro-tensile testing.
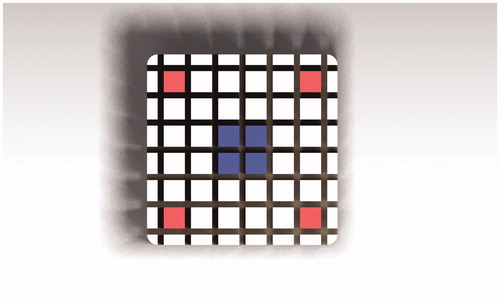
Table 2. Temperature measured in resin based composite test specimens in 5 °C water bath at different dwell times (n = 25).
Table 3. Temperature measured in resin based composite test specimens in 55 °C water bath at different dwell times (n = 25).
Table 4. Temperature measured in the centre of specimens at the adhesive layer in 5 °C water bath at different dwell times (n = 25).
Table 5. Temperature measured in the centre of specimens at the adhesive layer in 55 °C water bath at different dwell times (n = 25).
Table 6. Repair micro-tensile bond strength of test specimens stored in water for 3 months and tested after thermal cycling and without thermal cycling.