
Figures & data
Figure 1. Scanning electron microscope (SEM) micrographs showing A&B) smooth, C&D) minimally rough and E&F) moderately rough titanium discs surface. Scale bar for images in A, C and E = 100 μm, Scale bar for images in B, D and F = 10 μm.
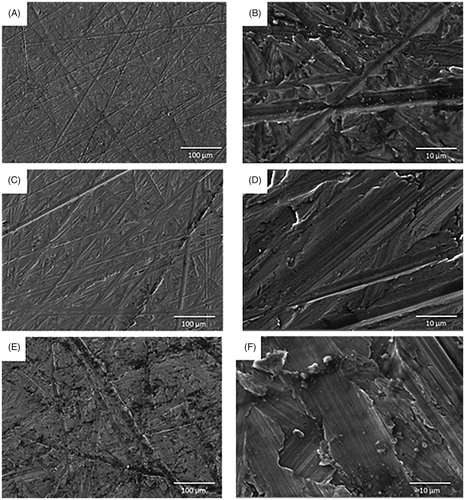
Table 1. Surface roughness, contact angle and surface free energy values (mean ± SD) of the three titanium discs groups.
Figure 2. C. albicans biofilm formation on titanium discs. The amount of biofilm formation (%) on titanium discs of increasing surface free energy (SFE) and with different roughness (Ra µm) was calculated using an XTT assay. Data displayed are median ± interquartile range of 3 independent experiments repeated on different occasions using different titanium discs and C.albicans culture each performed in triplicate. *p < 0.05 using Kruskal-Wallis followed by Dunn's post hoc multiple comparison statistical test.
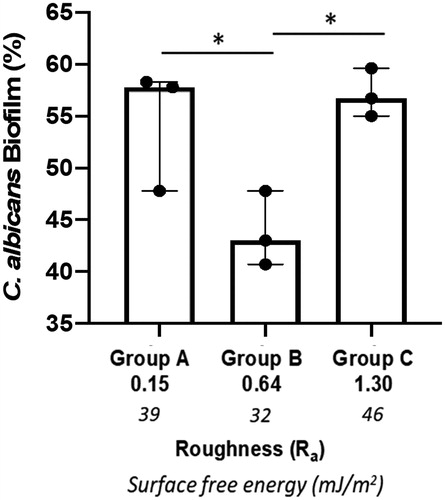
Figure 3. Scanning electron microscope (SEM) micrographs of the three different titanium discs surfaces showing C. albicans biofilm formation. Scale bar is 100 µm (A,C,E) and 20 µm (B,D,F).
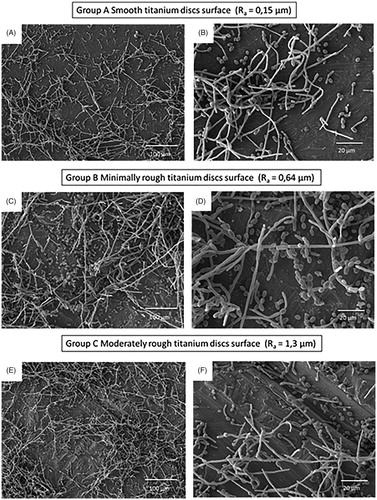
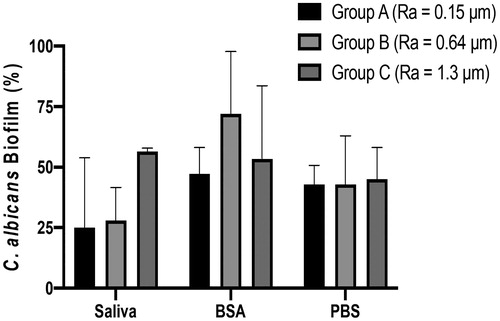
Figure 4. Influence of salivary pellicle on C. albicans biofilm formation. Titanium discs of different roughness were pre-coated with PBS, BSA or human saliva and incubated with C. albicans for 24 h, Amount of biofilm formation (%) was calculated using an XTT assay. Data displayed are median ± 95% CI of 3 independent experiments. Data were analysed by Kruskal-Wallis followed by Dunn’s post-hoc analysis for multiple comparisons.
Supplemental Material
Download PDF (369 KB)Supplemental Material
Download TIFF Image (1.6 MB)Data availability statement
The datasets generated during and/or analysed during the current study are available from the corresponding author on reasonable request.