
Figures & data
Figure 1. XRD analysis and Rietveld refinement. a) XRD patterns of the six CaP ceramics, with the peaks corresponding to the three main phases (HA, β-TCP, Periclase) indicated by arrows of different colors. b) Phase composition quantified by Rietveld refinement demonstrates the chemical composition differences between HA, TCP and BCP ceramics. c) Magnesium substitution percentage in the crystal lattice, obtained by Rietveld analysis. The error bars represent the estimated standard deviation in the quantification given by the model.
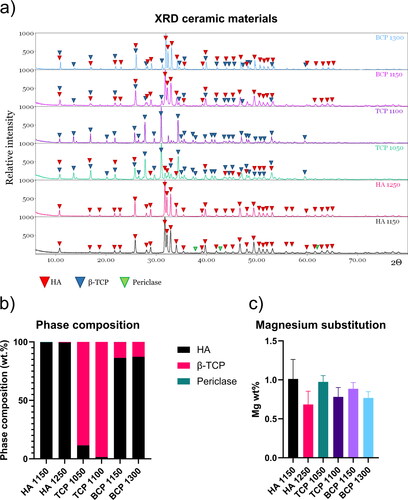
Table 1. Phase composition of the different materials.
Figure 2. ICP-MS analysis on CaP ceramics and culture medium. a–e) Ca, P, and Mg ion content of the six CaP ceramics. f–h) Ca, P, and Mg ion content of the cell culture medium. The error bars represent the standard deviation of 3 independent measurements.
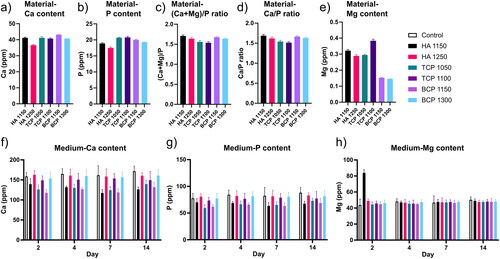
Figure 3. Structural analysis of CaP ceramics. a) High-resolution SEM micrographs illustrating the difference between osteoinductive (left column) and non-osteoinductive ceramics (right column). b) Pore size distribution obtained using mercury intrusion porosimetry analysis. Osteoinductive materials demonstrate to contain pores of multiple sizes. Pores were not detected for the non-osteoinductive materials except for TCP1100, which contains pores of a larger size. c) Grain size quantification demostrates low values for osteoinductive and high values for non-osteoinductive ceramics. d) Microporosity across the ceramics. e–j) Selected profilometric parameters demonstrate a larger diversity across the ceramics. k–m) Selected microCT parameters allowing a description of the 3D structures across the ceramics. The error bars represent the standard deviation of 3 independent measurements.
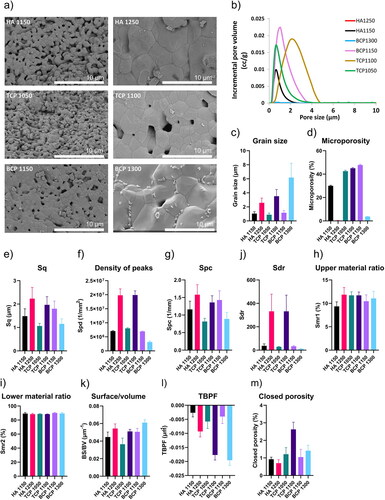
Figure 4. Heat map showing Spearman correlations among material properties of the CaP ceramics. Positive correlations between material parameters are marked in blue, while negative correlations are marked in red.
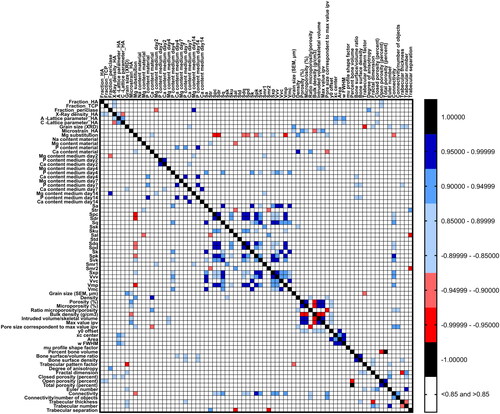
Figure 5. Characterization of material parameters allows identifying common characteristics in the ceramic materials. a) PCA plot of the six CaP ceramics based on the quantified materials parameters. The osteoinductive materials BCP1150, HA1150, and TCP1050 cluster together on the left side of the plot. The non-osteoinductive ceramics appear to be more distinct between each other. b) Hierarchical cluster analysis of the material properties illustrates common and distinct material characteristics across the materials. Cluster four, containing parameters of grain size and Ca/P/Mg content in the medium, allows for distinguishing osteoinductive and non-osteoinductive ceramics.
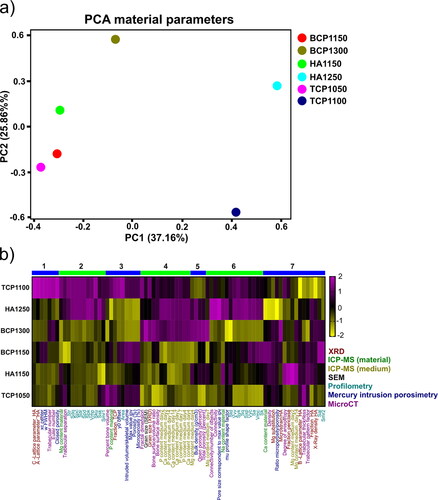
Figure 6. CaP ceramics induce distinct gene expression profiles in MG63 cells and allow a correlation analysis with material properties. a) Hierarchical cluster analysis of the top 500 genes with strongest gene expression variation across the six CaP ceramics. Ceramics with identical chemical compositions cluster together except for the BCP ceramics. b) Heatmap showing the frequency of significant correlations between CaP ceramic properties and pathways associated with osteogenesis.
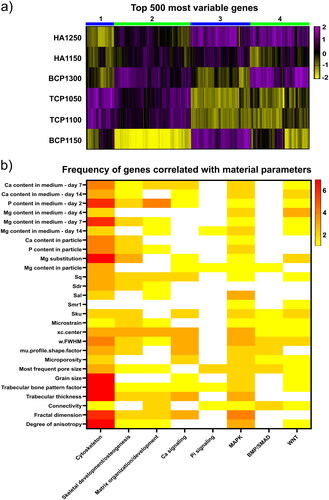
Table 2. Genes correlated with the microporosity parameter with known relevant functions.
Data availability statement
The raw/processed data to reproduce these findings is available in the following repository: https://doi.org/10.34894/VWMT6T