Figures & data
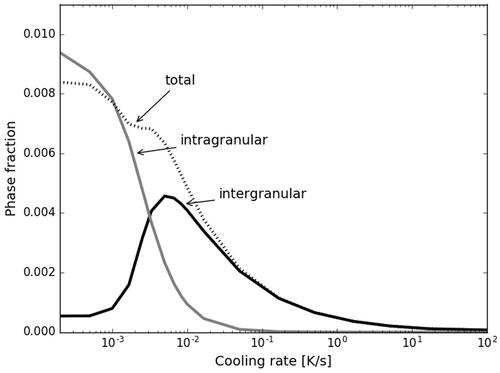
Figure 1. Microstructure of the alloy AA6016 containing primary Al-Fe-Si particles (white), Si (black), and Mg2Si (dark-gray) precipitates. The width of the images is 100 µm. (a) Image from inlens secondary electron (SE) detector. (b–d) Energy dispersive X-ray spectrometry scans of the main alloying elements Si, Mg, and Fe.
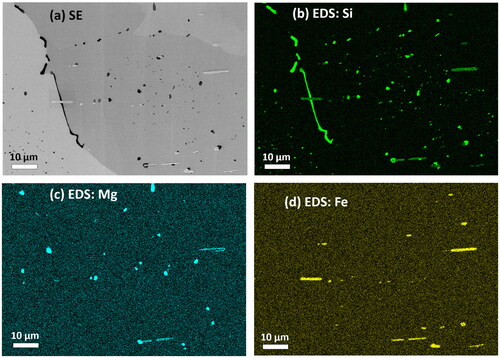
Figure 2. Microstructure of the AA6016 as measured by the inlens secondary electron detector at Position A. The width of the image is 500 µm.
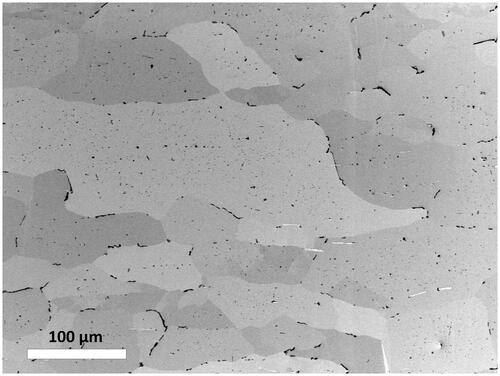
Figure 3. Microstructure of the AA6016 as measured by the inlens secondary electron detector at Position B. The width of the image is 500 µm.
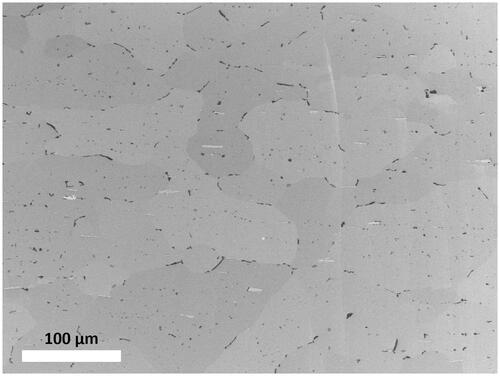
Table 1. Main alloying elements of AA6016 in wt.%.
Table 2. Microstructure after coil cooling.
Table 3. Summary of model parameters for Si in AA6016.
Figure 4. Temperature curve (black line) and cooling rate (gray line) used for the coil cooling simulation.
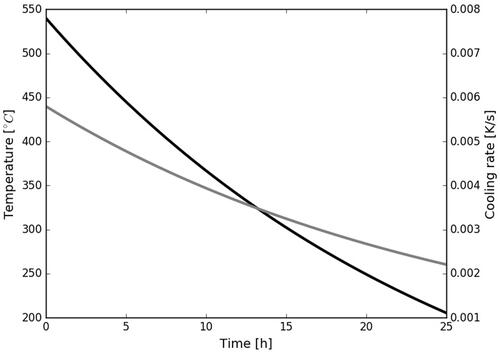
Figure 5. Model results for coil cooling: (a) Growth of inter- and intragranular Si precipitates. (b) Evolution of the Si concentration in the grain boundary and in the matrix in comparison with the matrix equilibrium concentration.
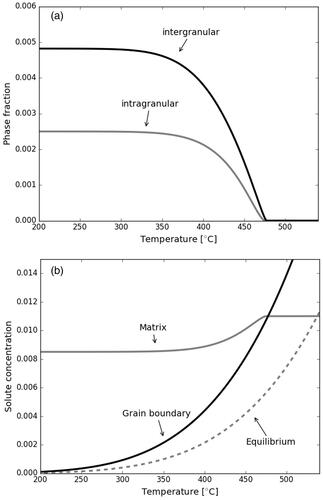
Figure 6. Effect of a variation of the Si content on (a) the total, inter-, and intragranular phase fractions, and (b) the mean intragranular precipitate diameter (grey dashed line) and the width of the PFZ (black line) after coil cooling.
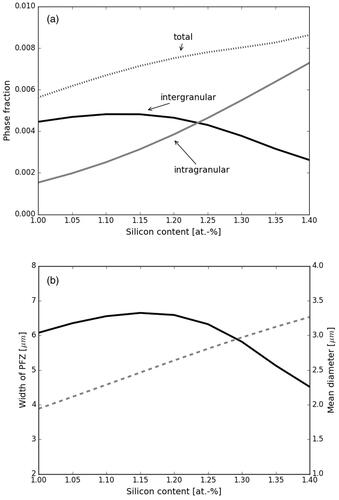
Figure 7. Microstructure of the Al-Mg-Si alloy as shown in (a). Dark intragranular precipitates adjacent to bright primary Fe-based particles are highlighted with circles to emphasize their role as heterogeneous nucleation sites.
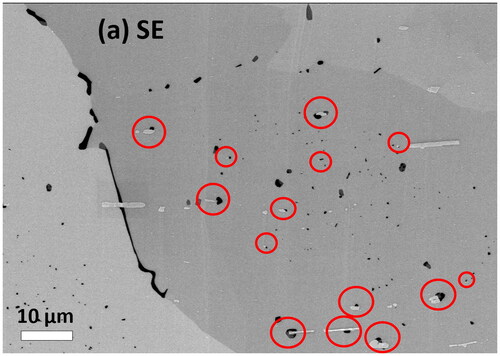
Figure 8. Effect of a variation of the intragranular precipitate number density on (a) the total, inter-, and intragranular phase fraction, and (b) the mean intragranular precipitate diameter (gray dashed line) and the width of the PFZ (black line) after coil cooling.
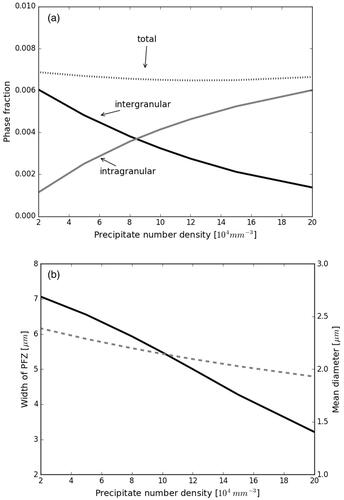
Figure 9. Total, inter-, and intragranular phase fraction after coil cooling dependent on the grain boundary density. The intergranular and the total phase fraction both increase linearly with the grain boundary density but with different slopes.
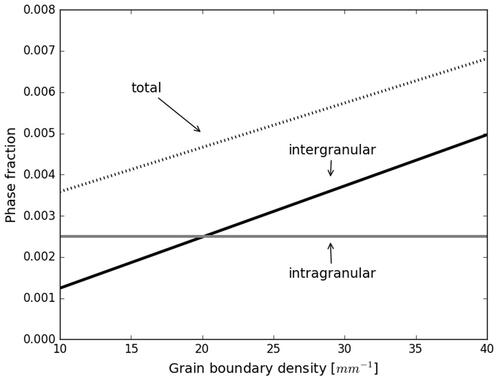
Figure 10. Effect of the cooling rate on the total, inter-, and intragranular phase fractions after continuous cooling.