
Figures & data
Figure 1. Steps followed from RW to final MEX 3D printed products.
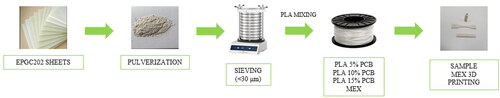
Figure 2. SEM analysis at magnification levels (a) 1000× and FR4 point selection for element identification tool (b), 3300× and PLA_PCB_0.15 point selection for element identification tool.
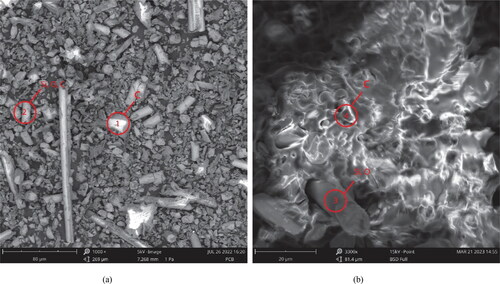
Table 1. Elemental composition of selected points by EDS.
Figure 3. DSC analysis of pure and composite filaments.
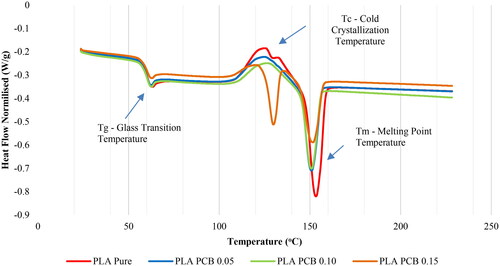
Table 2. Tg, Tc, and Tm of pure and composite filaments.
Table 3. Xc of pure and composite filaments.
Figure 4. Viscosity against shear rate for pure and composite filaments.
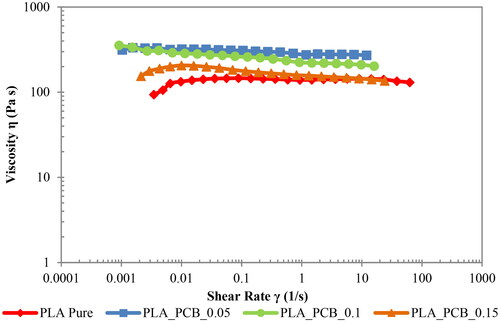
Figure 5. Stress against shear rate for pure and composite filaments.
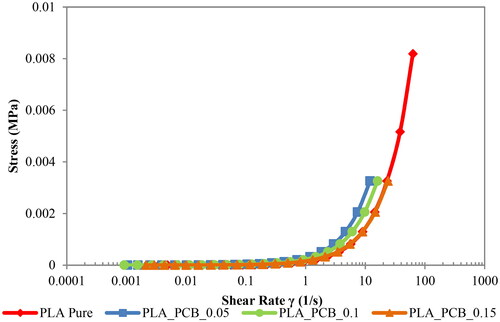
Figure 6. Stress/strain diagram of all four filaments – tension test.
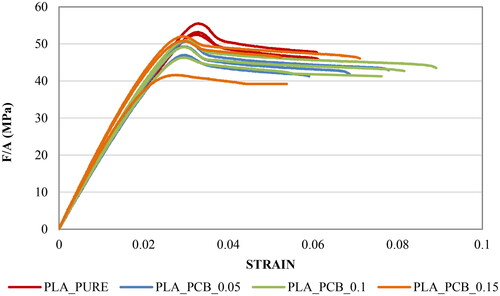
Figure 7. Elastic modulus derived from tension tests of all four filaments.
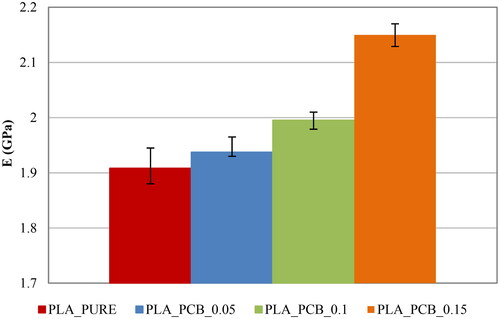
Figure 8. Tensile strength derived from tension tests of all four filaments.
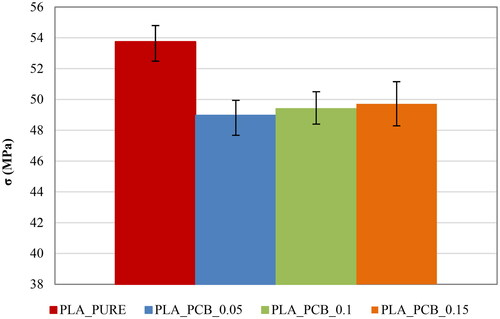
Figure 9. Elongation at break derived from tension tests of all four filaments.
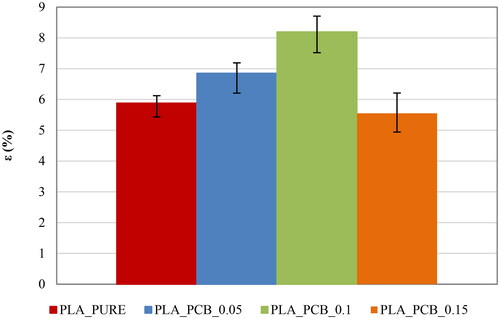
Table 4. Mean E, σ, and ε of pure and composite filaments – tension tests.
Figure 10. Load/displacement diagram of all four filaments – 3-point-bending test.
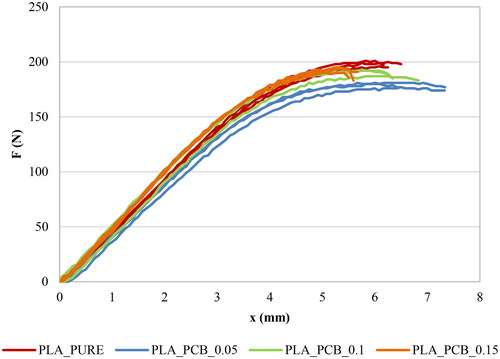
Figure 11. Flexural elastic modulus derived from 3-point-bending tests of all four filaments.
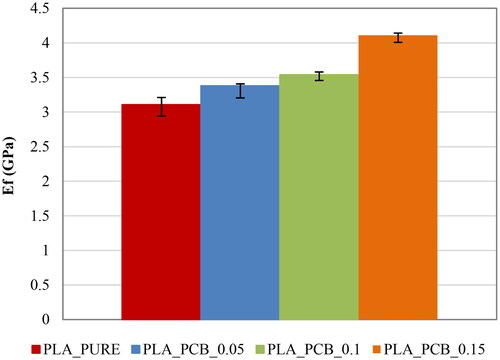
Figure 12. Flexural stress derived from 3-point-bending tests of all four filaments.
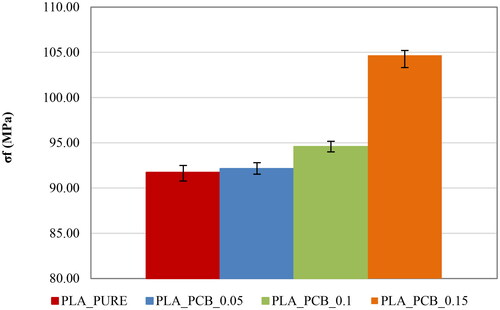
Table 5. Mean Ef and σf of pure and composite filaments – 3-point-bending tests.
Table A.1. Printer and filament settings.
Figure B.1. EPGC202 powder DSC analysis.
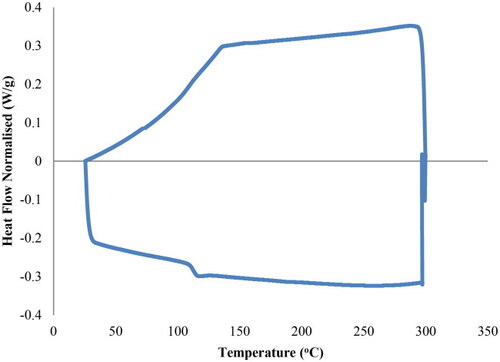
Figure C.1. D638-10 Type IV ASTM dimensions.
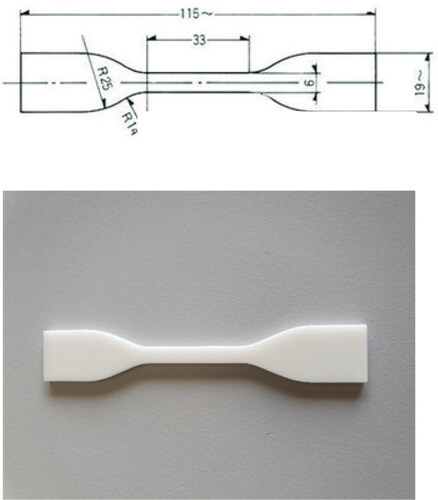
Figure C.2. ISO 178 parallelepiped dimensions.
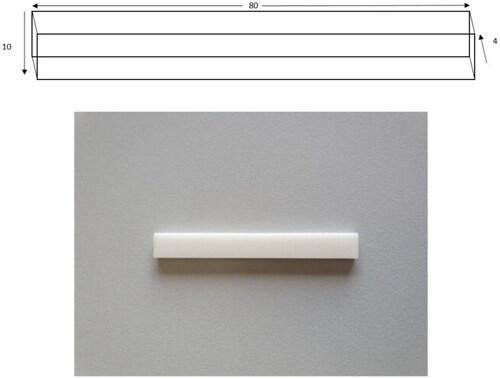
Table C.1. Width of samples (b) and thickness of samples (d).