
Figures & data
Figure 1. Scores of RC extract calculated by relative aggregated metric (RAM) using the normalized yield scores and SaOS-2 cell viability scores.
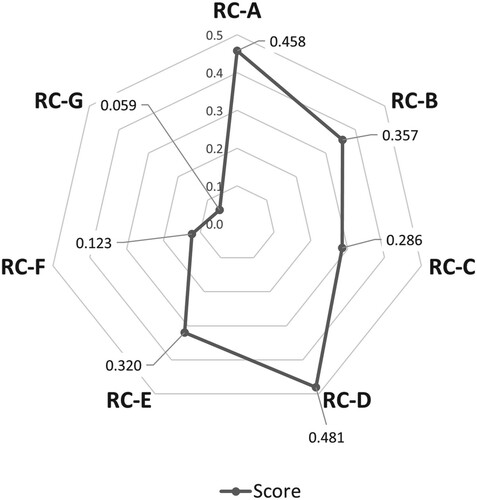
Figure 2. The effects of RC extracts on cell viability (A) and ALP activity (B) in SaOS-2 cells. The cells were treated by 300 µg/ml extracts (P: pomegranate extract; RC-A to RC-G: RC extracted using different percentage of ethanol) and 0.1 nM of E for 48 h. The percentage of cell viability and ALP activity were calculated in comparison to the untreated control cells (NC). The primer sequences and the condition for qRT-PCR analysis (D). The osteoblastic and osteoclastic gene expression in SaOS-2 cells treated with R (RC-D), P (pomegranate extract) at 100, 300 µg/ml and E (17β-estradiol) at 0.1 and 1.0 nM. Values were expressed as mean ± SEM, ┼p < 0.05 compared to P, #p < 0.05, ##p < 0.01 and ###p < 0.0001 compared to E; *p < 0.05.
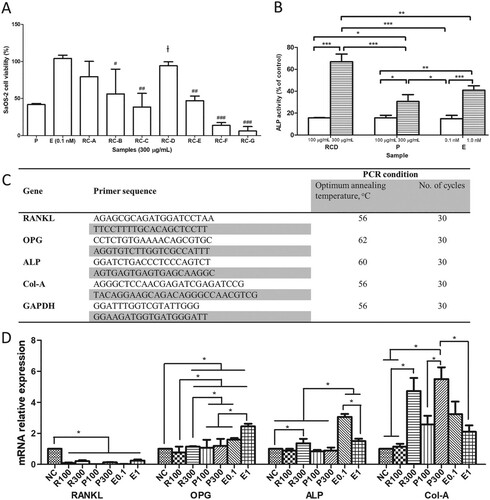
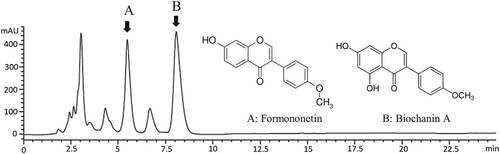
Figure 3. Representative HPLC chromatogram for RC-D. Eluent: ACN:water (60%:40%) acidified with 0.5% phosphoric acid at 1 ml/min detected at 254 nm. Arrows indicate peaks for formononetin (A) and biochanin A (B). Chromatogram of the standard of formononetin and biochanin A (inset).
Supplemental Material
Download MS Excel (11.1 KB)Data availability statement
The data that support the findings of this study are available from the corresponding author, Seung-Chun Park, upon reasonable request. Supplementary material containing the worksheet of RAM computation is available at https://doi.org/10.6084/m9.figshare.12250919.