
Figures & data
Figure 1. Assay mixture with the addition of sodium deoxycholate (SDC) and Triton X-100 (TX-100).
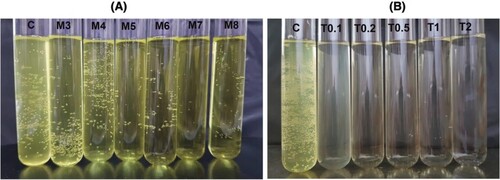
Figure 2. Effect of emulsifiers on the rate of hydrolysis.
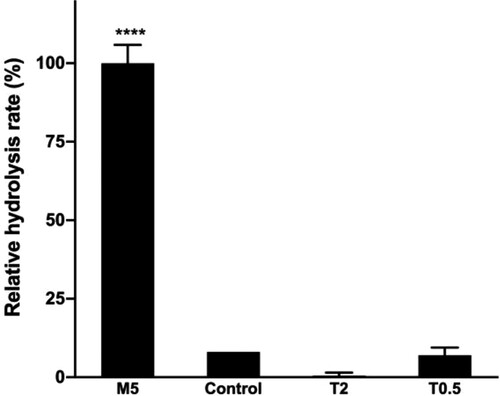
Figure 3. Effect of incubation time at 37°C on the rate of hydrolysis.
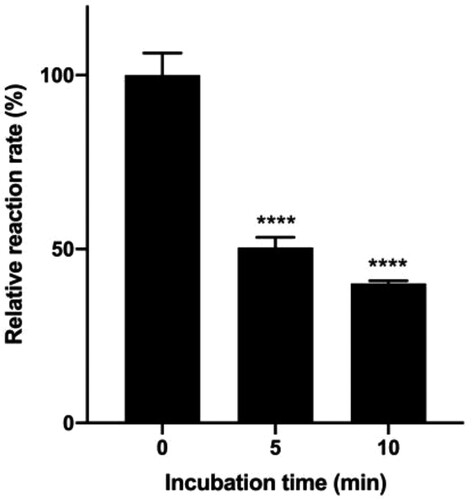
Figure 4. Relative hydrolysis rates in different buffers and pH.
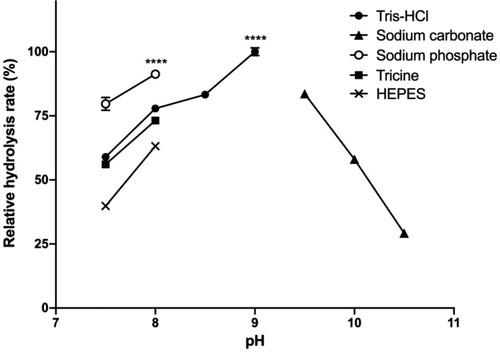
Figure 5. Effect of organic co-solvent on hydrolysis rates.
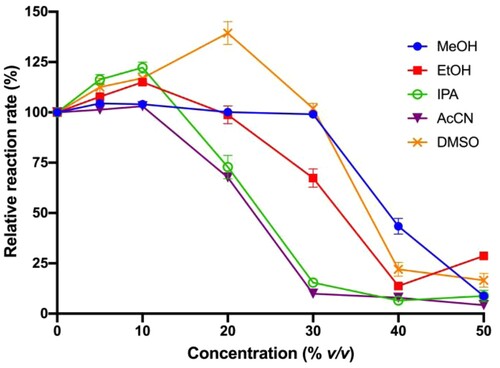
Figure 6. Effects of NaCl (a) or CaCl2 (b) on hydrolysis rates.
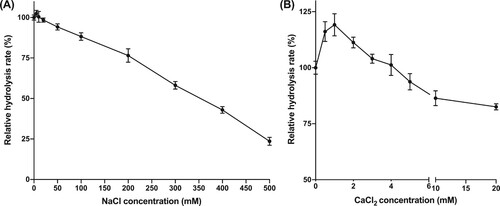
Figure 7. Relative hydrolysis rates of lipase solutions stored at –20°C with the addition of different amounts of glycerol as antifreeze.
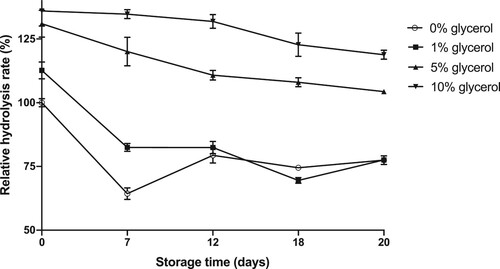
Table 1. Experimental conditions for in vitro lipase inhibitory assay.
Table 2. IC50 values determined by proposed condition sets.
Data availability statement
The data that support the findings of this study are available in figshare [https://figshare.com/] at http://doi.org/10.6084/m9.figshare.16864072.v1.