
Figures & data
Figure 1. A map showing the collection sites of 85 Q. infectoria accessions.
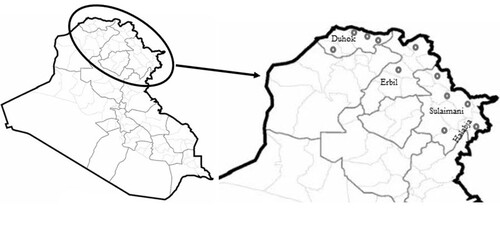
Table 1. Summarizes information of 85 Q. infectoria accessions used in this study.
Table 2. Sequence of the CDDP primers and their effectiveness and polymorphism utilized in Q. infectoria accessions.
Table 3. ISSR sequence primers used in Q. infectoria accessions, as well as their efficacy and polymorphism.
Figure 2. Amplification profiles in Q. infectoria accessions using various primers. (A) ERF-1 and (B) ISSR-11.
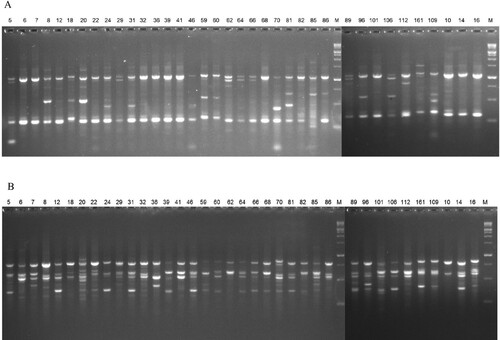
Figure 3. Dendrogram relying on Ward's Hierarchical Clustering method illustrating genetic associations of 85 Q. infectoria accessions. (A) CDDP, (B) ISSR, and (C) CDDP + ISSR data. Red and green colors represent groups 1 (Gr1) and 2 (Gr2), respectively. The numbers SC11 and SC2 denoted the number of sub-clusters. The accessions used in this study were denoted by the letters ACC1-ACC85. More information on accessions can be found in Table .
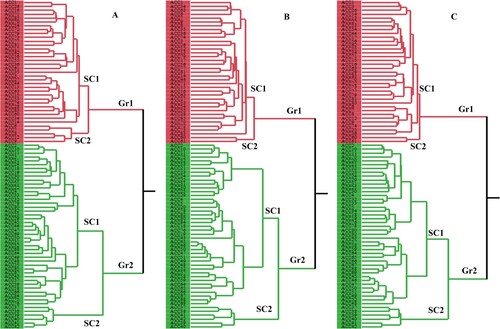
Figure 4. STRUCTURE output of 85 accessions based on CDDP data. (A) Evanno’s ad hoc statistic of K scale. (B) Population structure of 85 Q. infectoria accessions at K = 2. Each color represents a specific population subset. The horizontal axis numbers (1–85) correspond to the individual codes of Q. infectoria accessions. Table contains information on accessions.
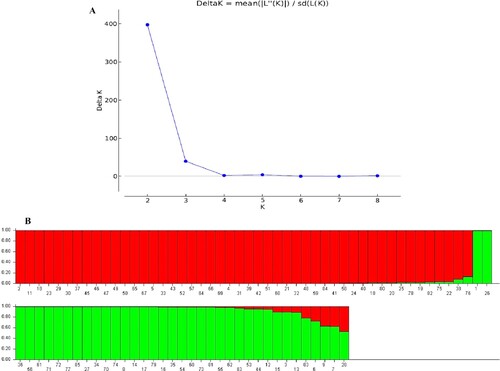
Figure 5. STRUCTURE analysis of 85 accessions based on ISSR data. (A) Evanno’s ad hoc statistic of K ranging from 1 to 9, with a peak at the ‘ideal’ number of population clusters. (B) Population structure of 85 Q. infectoria accessions at K = 2. Each color denotes a specific population category. The numbers (1–85) on the horizontal axis correspond to the individual codes of Q. infectoria accessions. Table contains information about accessions.
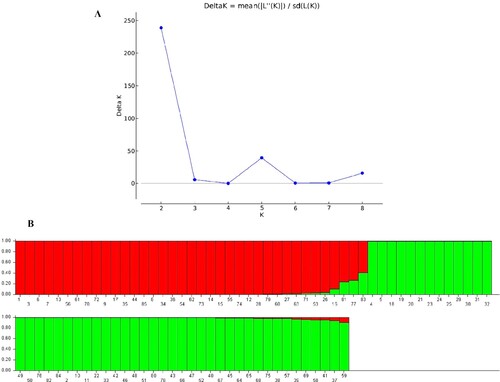
Figure 6. STRUCTURE results of 85 accessions based on CDDP and ISSR data. (A) Evanno’s ad hoc statistic of K. (B) Population structure of 85 Q. infectoria accessions at K = 2. Each color denotes a specific population subset. The horizontal axis numbers (1–85) refer to the individual codes of Q infectoria accessions. Table gives details on accessions.
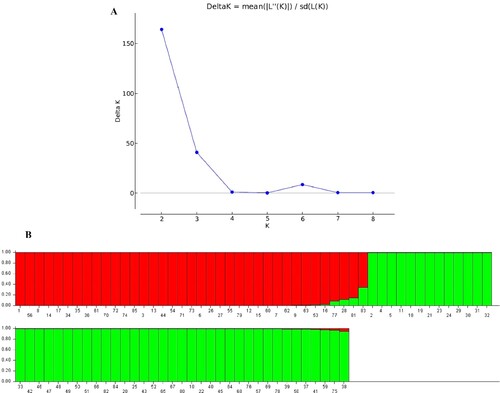
Figure 7. Illustrating gene flow among populations based on CDDP, ISSR, and combined (CDDP + ISSR) data.
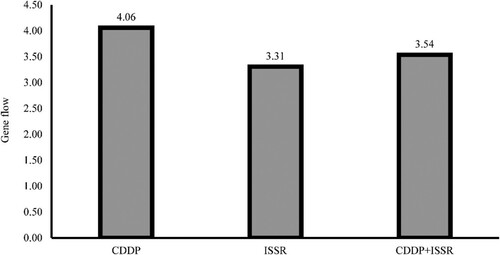
Table 4. STRUCTURE reporting of 85 Q. infectoria accessions for the inferred cluster, fixation index (Fst), and expected heterozygosity
Table 5. AMOVA for the Q. infectoria accessions analyzed based on CDDP, ISSR, and combined data.
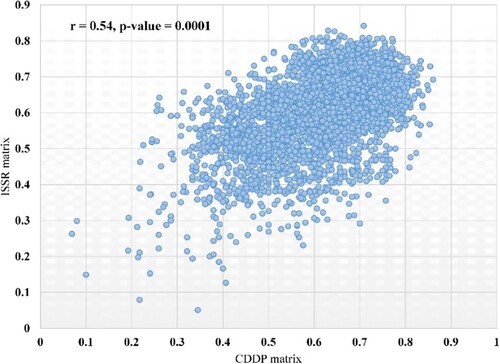
Figure 8. Mantel tests showing the correlation between the CDDP and ISSR distance matrices.
Data availability statement
The data supporting the findings of this research is accessible via the 4TU. Research Data repository [https://data.4tu.nl/portal] at https://doi.org/10.4121/16783090.v2.